> ## Documentation Index
> Fetch the complete documentation index at: https://docs.mantlebio.com/llms.txt
> Use this file to discover all available pages before exploring further.
# Spatial Transcriptomics Tutorial
## Introduction
Spatial transcriptomics is the visualization and quantification of gene expression in tissue sections, maintaining the spatial context of the tissue architecture. One technology for spatial transcriptomics is 10x Genomics Visium. It uses a slide with an array of spots, each containing barcoded oligonucleotides, to capture mRNA from tissue sections placed on the slide. The mRNA then undergoes high-throughput RNA sequencing. The raw results from Visium experiments include a microscopy image of the tissue slice on the Visium slide and sequencing reads in FASTQ format. In order to use this data to reveal insights into cellular microenvironments, cellular heterogeneity, and spatial relationships within tissue, the data require processing, including the typical steps taken for processing RNA sequencing reads, as well as tissue detection and determination of which barcode spots overlap with the tissue.
Mantle can be used for data management, preprocessing, and downstream analysis of spatial transcriptomics data.
All data, pipelines, and analysis environments in this tutorial are available in your Mantle account.
## Raw data
Both images and FASTQ data cannot be easily stored in typical databases. An individual FASTQ file is semi-structured, and images are unstructured. Storing these files within a database as binary large objects (BLOBs) can be challenging due to their large size (typically tens of gigabytes per FASTQ directory).
In Mantle, you can store data files and associated metadata together as **datasets**. Here, experimental data files are stored as datasets of the `spatial-experiment` **data type**. Expand to view the properties of `spatial-experiment` datasets:
Directory containing RNA sequencing FASTQ files
Microscopy image file
`image`, `darkimage`, `colorizedimage`, or `cytaimage`.
Used as an input to Spaceranger Count as `-- `.
See the [Spaceranger Count documentation](https://www.10xgenomics.com/support/software/space-ranger/latest/analysis/running-pipelines/command-line-arguments) for more information.
The Visium slide serial number. Corresponds to the `slide` input to Spaceranger Count. See the [Spaceranger Count documentation](https://www.10xgenomics.com/support/software/space-ranger/latest/analysis/running-pipelines/command-line-arguments) for more information.
Optional. The slide design file for your slide. See the [Spaceranger Count documentation](https://www.10xgenomics.com/support/software/space-ranger/latest/analysis/running-pipelines/command-line-arguments) for more information.
Optional. The slide design file for your slide. Corresponds to the `loupe-alignment` input to Spaceranger Count. See the [Spaceranger Count documentation](https://www.10xgenomics.com/support/software/space-ranger/latest/analysis/running-pipelines/command-line-arguments) for more information.
Visium capture area identifier. Corresponds to the `area` input to Spaceranger Count. See the [Spaceranger Count documentation](https://www.10xgenomics.com/support/software/space-ranger/latest/analysis/running-pipelines/command-line-arguments) for more information.
Optional. The publication that the data originated from.
Optional. The SRA Accession Number for the FASTQ files.
In this example workflow, we've included a subset of the data from this manuscript:
> Sudmeier, et al. (2022) "Distinct phenotypic states and spatial distribution of CD8+ T cell clonotypes in human brain metastases." Cell Reports Medicine, 3(5), 100620
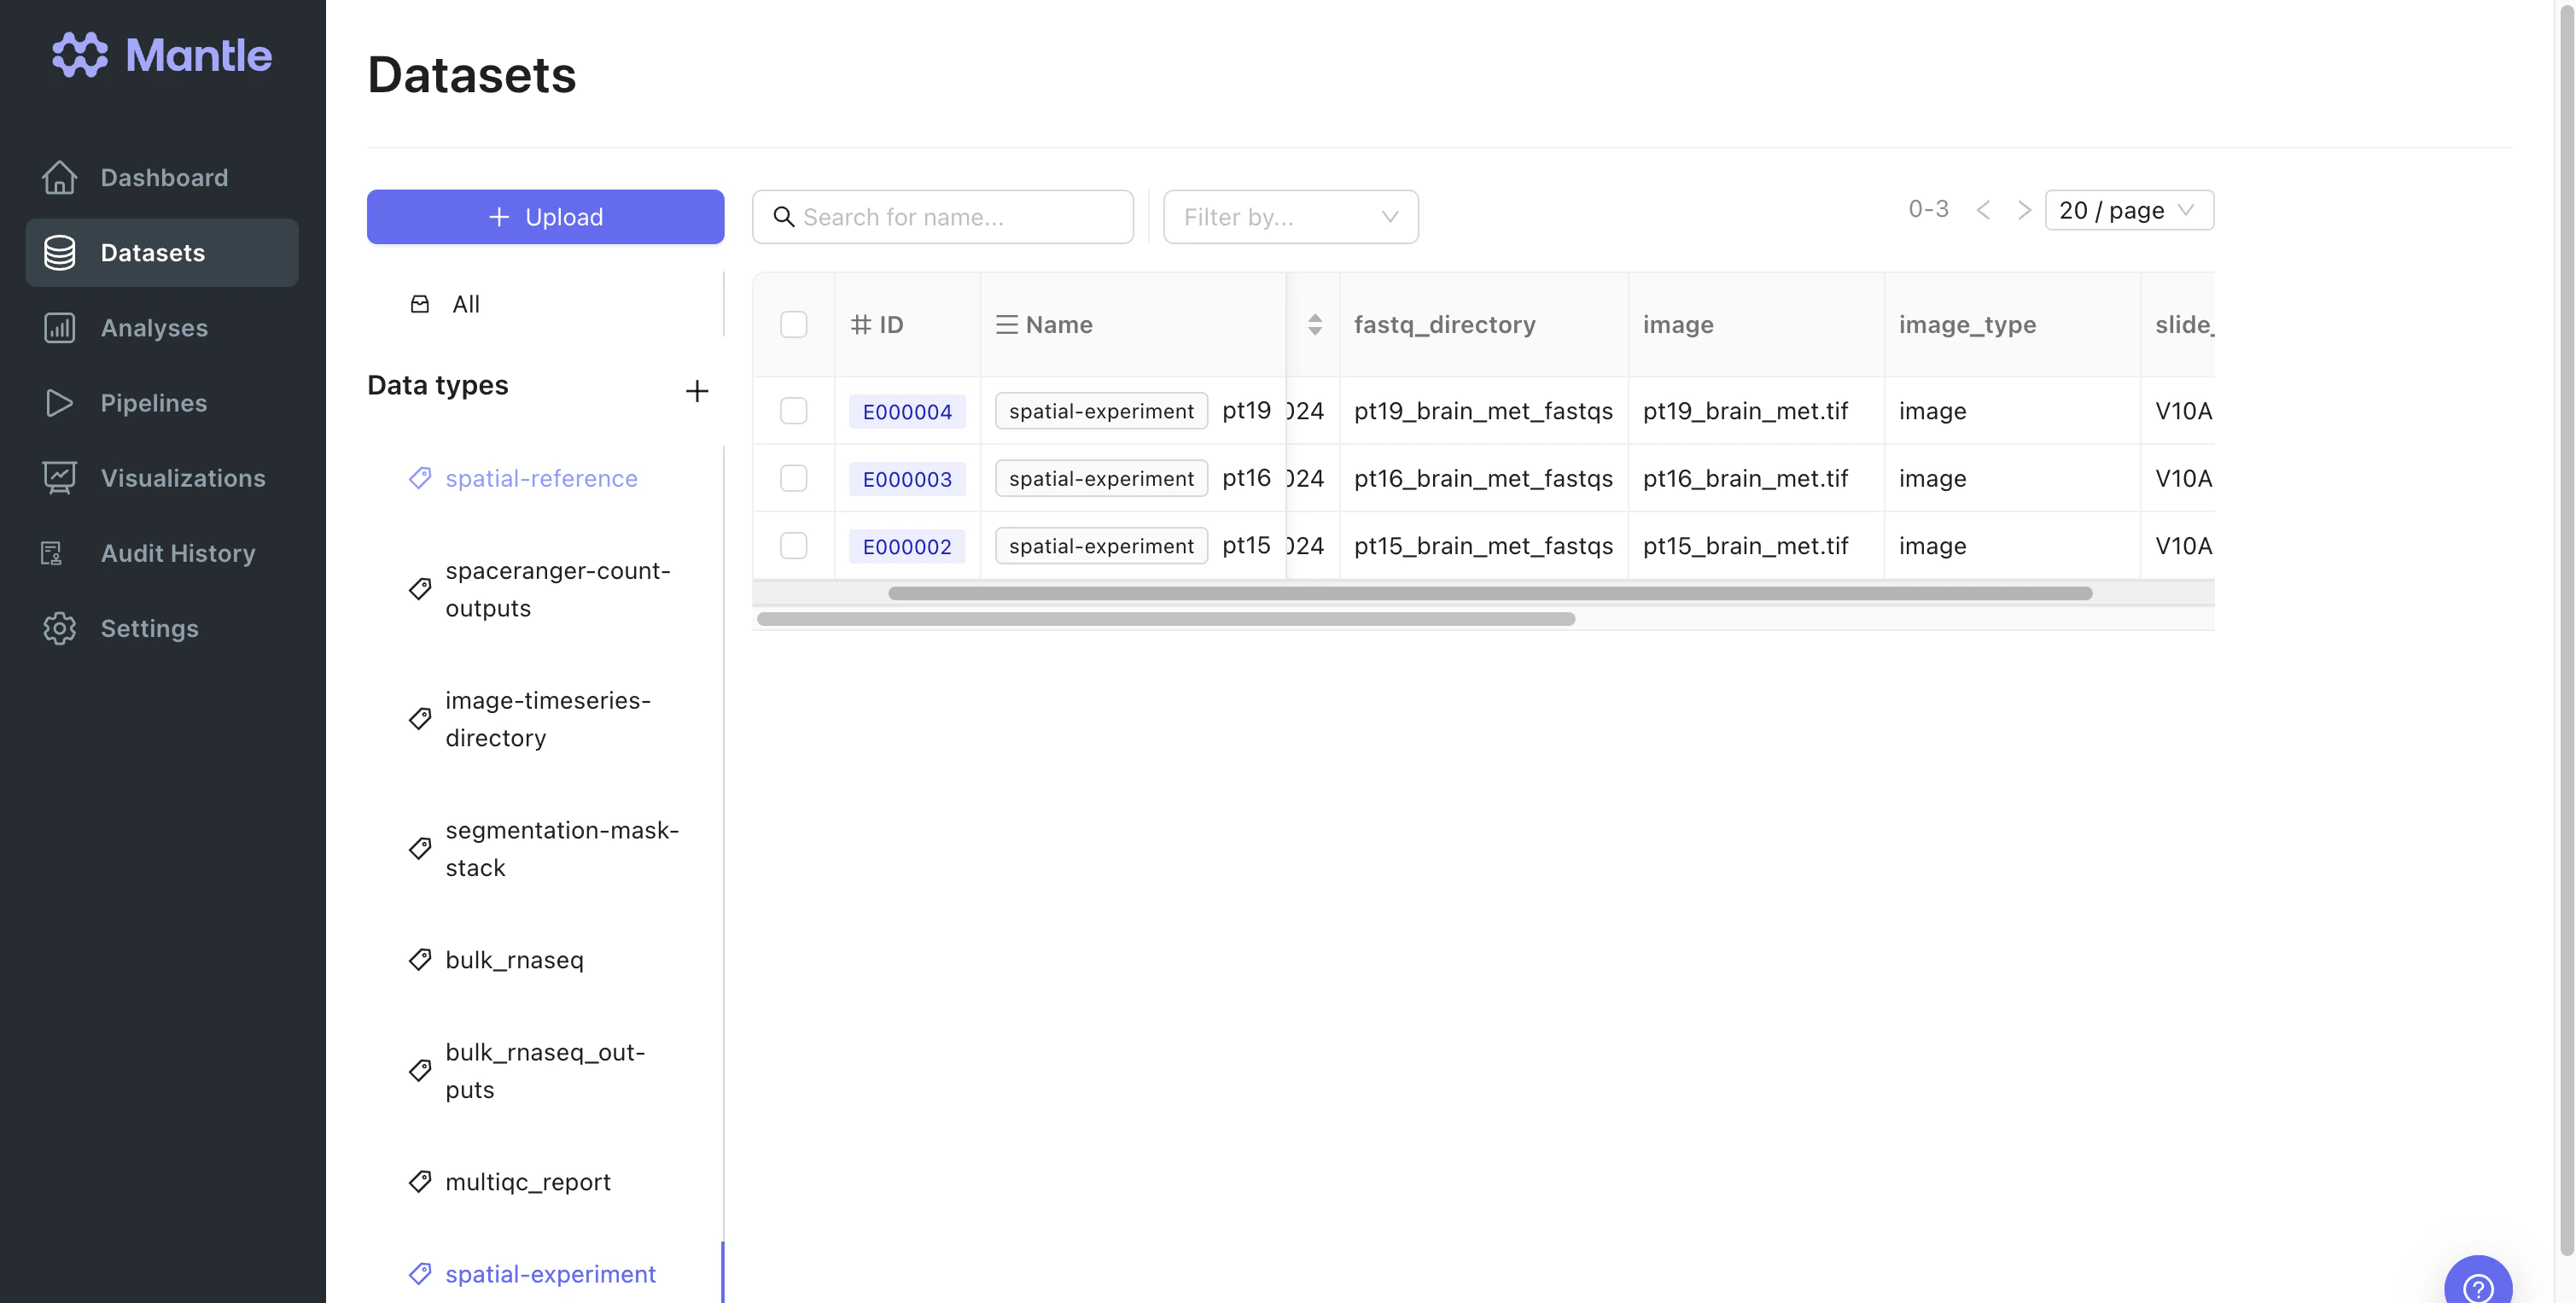 To perform sequence alignment, a reference genome is needed. 10x has references available for human (`GRCH38-2020-A`) and mouse (`mm10-2020-A`) genomes. We packaged them into the `spatial-reference` datasets.
Depending on your experimental workflow, you may also need a spatial probe file for data processing. 10x also has probesets available for human and mouse, which we have packaged into the `spatial-probes` datasets.
## Data processing
In our demonstration workflow, spatial transcriptomics experiment data is processed using a Nextflow pipeline that runs [10x Spaceranger Count](https://www.10xgenomics.com/support/software/space-ranger/latest). Spaceranger Count is a command line tool. Its inputs include FASTQ files, a microscope image, slide ID and capture area, and reference transcriptome. It is computationally intensive to run, requiring at least an 8-core processor (32 cores recommended), 64 GB RAM (128 GB recommended), and 1 TB free disk space.
Our `spaceranger-count` pipeline takes as input a dataset of the `spatial-experiment` type and a dataset of the `spatial-reference` type. The `spatial-experiment` dataset contains most of the Spaceranger Count required inputs as properties. The reference transcriptome is stored in the `spatial-reference` dataset. When you run this pipeline on Mantle, all the hardware provisioning is taken care of for you.
To perform sequence alignment, a reference genome is needed. 10x has references available for human (`GRCH38-2020-A`) and mouse (`mm10-2020-A`) genomes. We packaged them into the `spatial-reference` datasets.
Depending on your experimental workflow, you may also need a spatial probe file for data processing. 10x also has probesets available for human and mouse, which we have packaged into the `spatial-probes` datasets.
## Data processing
In our demonstration workflow, spatial transcriptomics experiment data is processed using a Nextflow pipeline that runs [10x Spaceranger Count](https://www.10xgenomics.com/support/software/space-ranger/latest). Spaceranger Count is a command line tool. Its inputs include FASTQ files, a microscope image, slide ID and capture area, and reference transcriptome. It is computationally intensive to run, requiring at least an 8-core processor (32 cores recommended), 64 GB RAM (128 GB recommended), and 1 TB free disk space.
Our `spaceranger-count` pipeline takes as input a dataset of the `spatial-experiment` type and a dataset of the `spatial-reference` type. The `spatial-experiment` dataset contains most of the Spaceranger Count required inputs as properties. The reference transcriptome is stored in the `spatial-reference` dataset. When you run this pipeline on Mantle, all the hardware provisioning is taken care of for you.
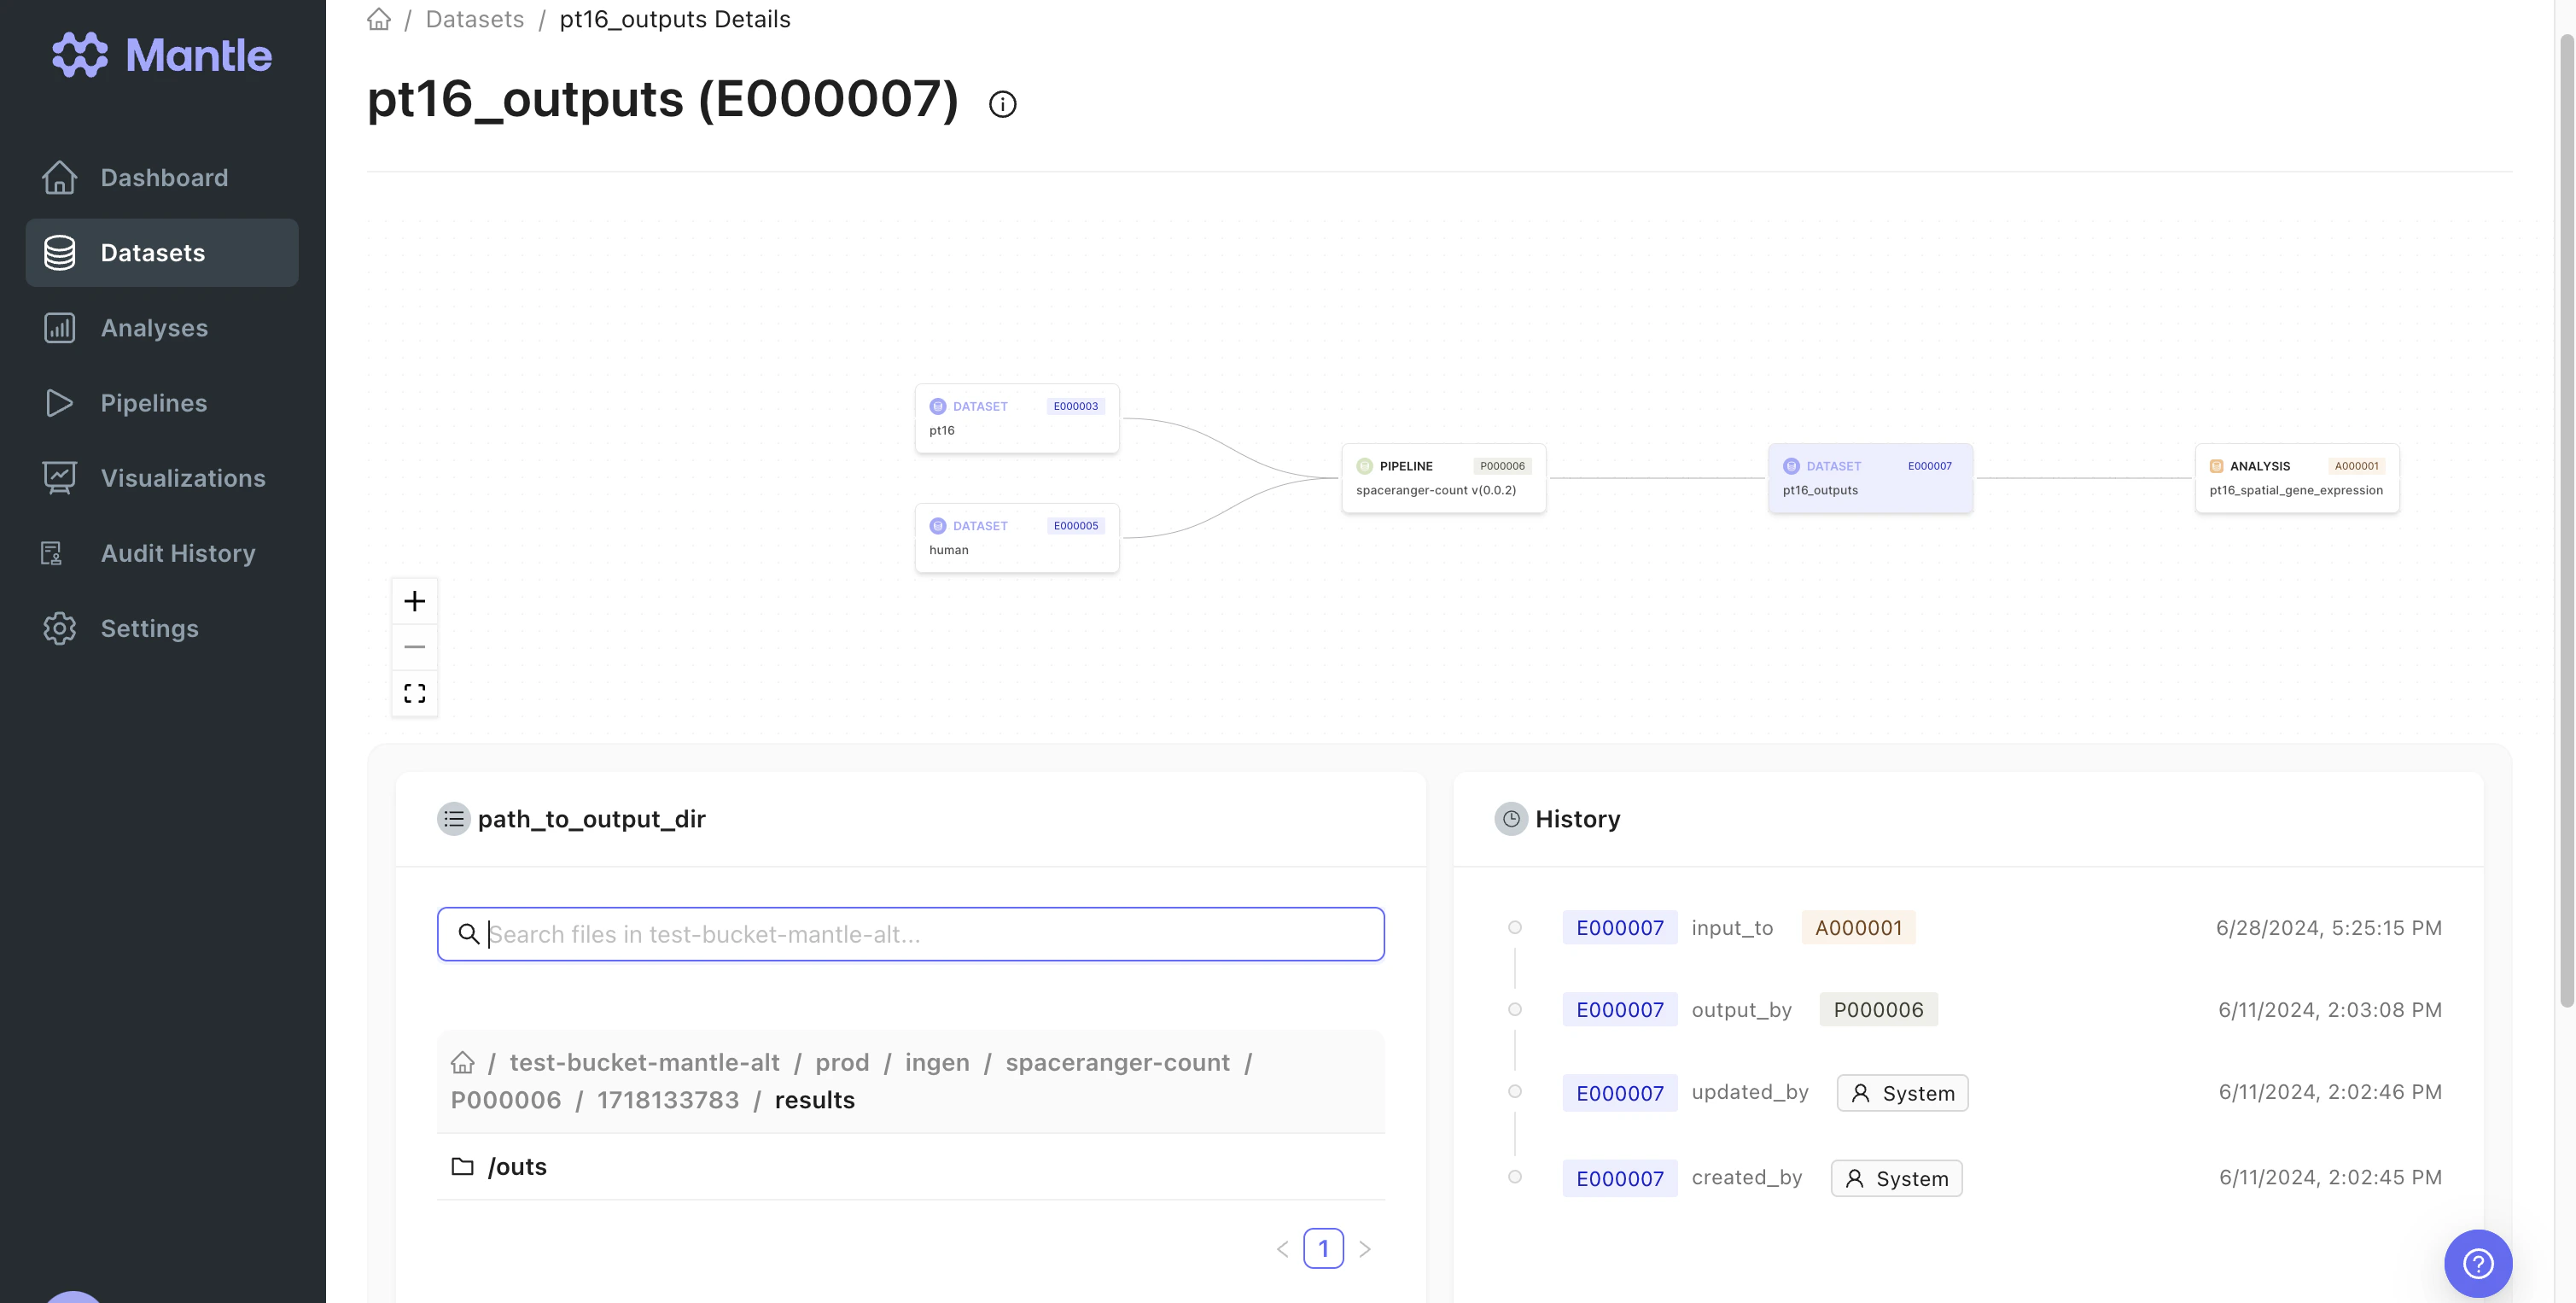
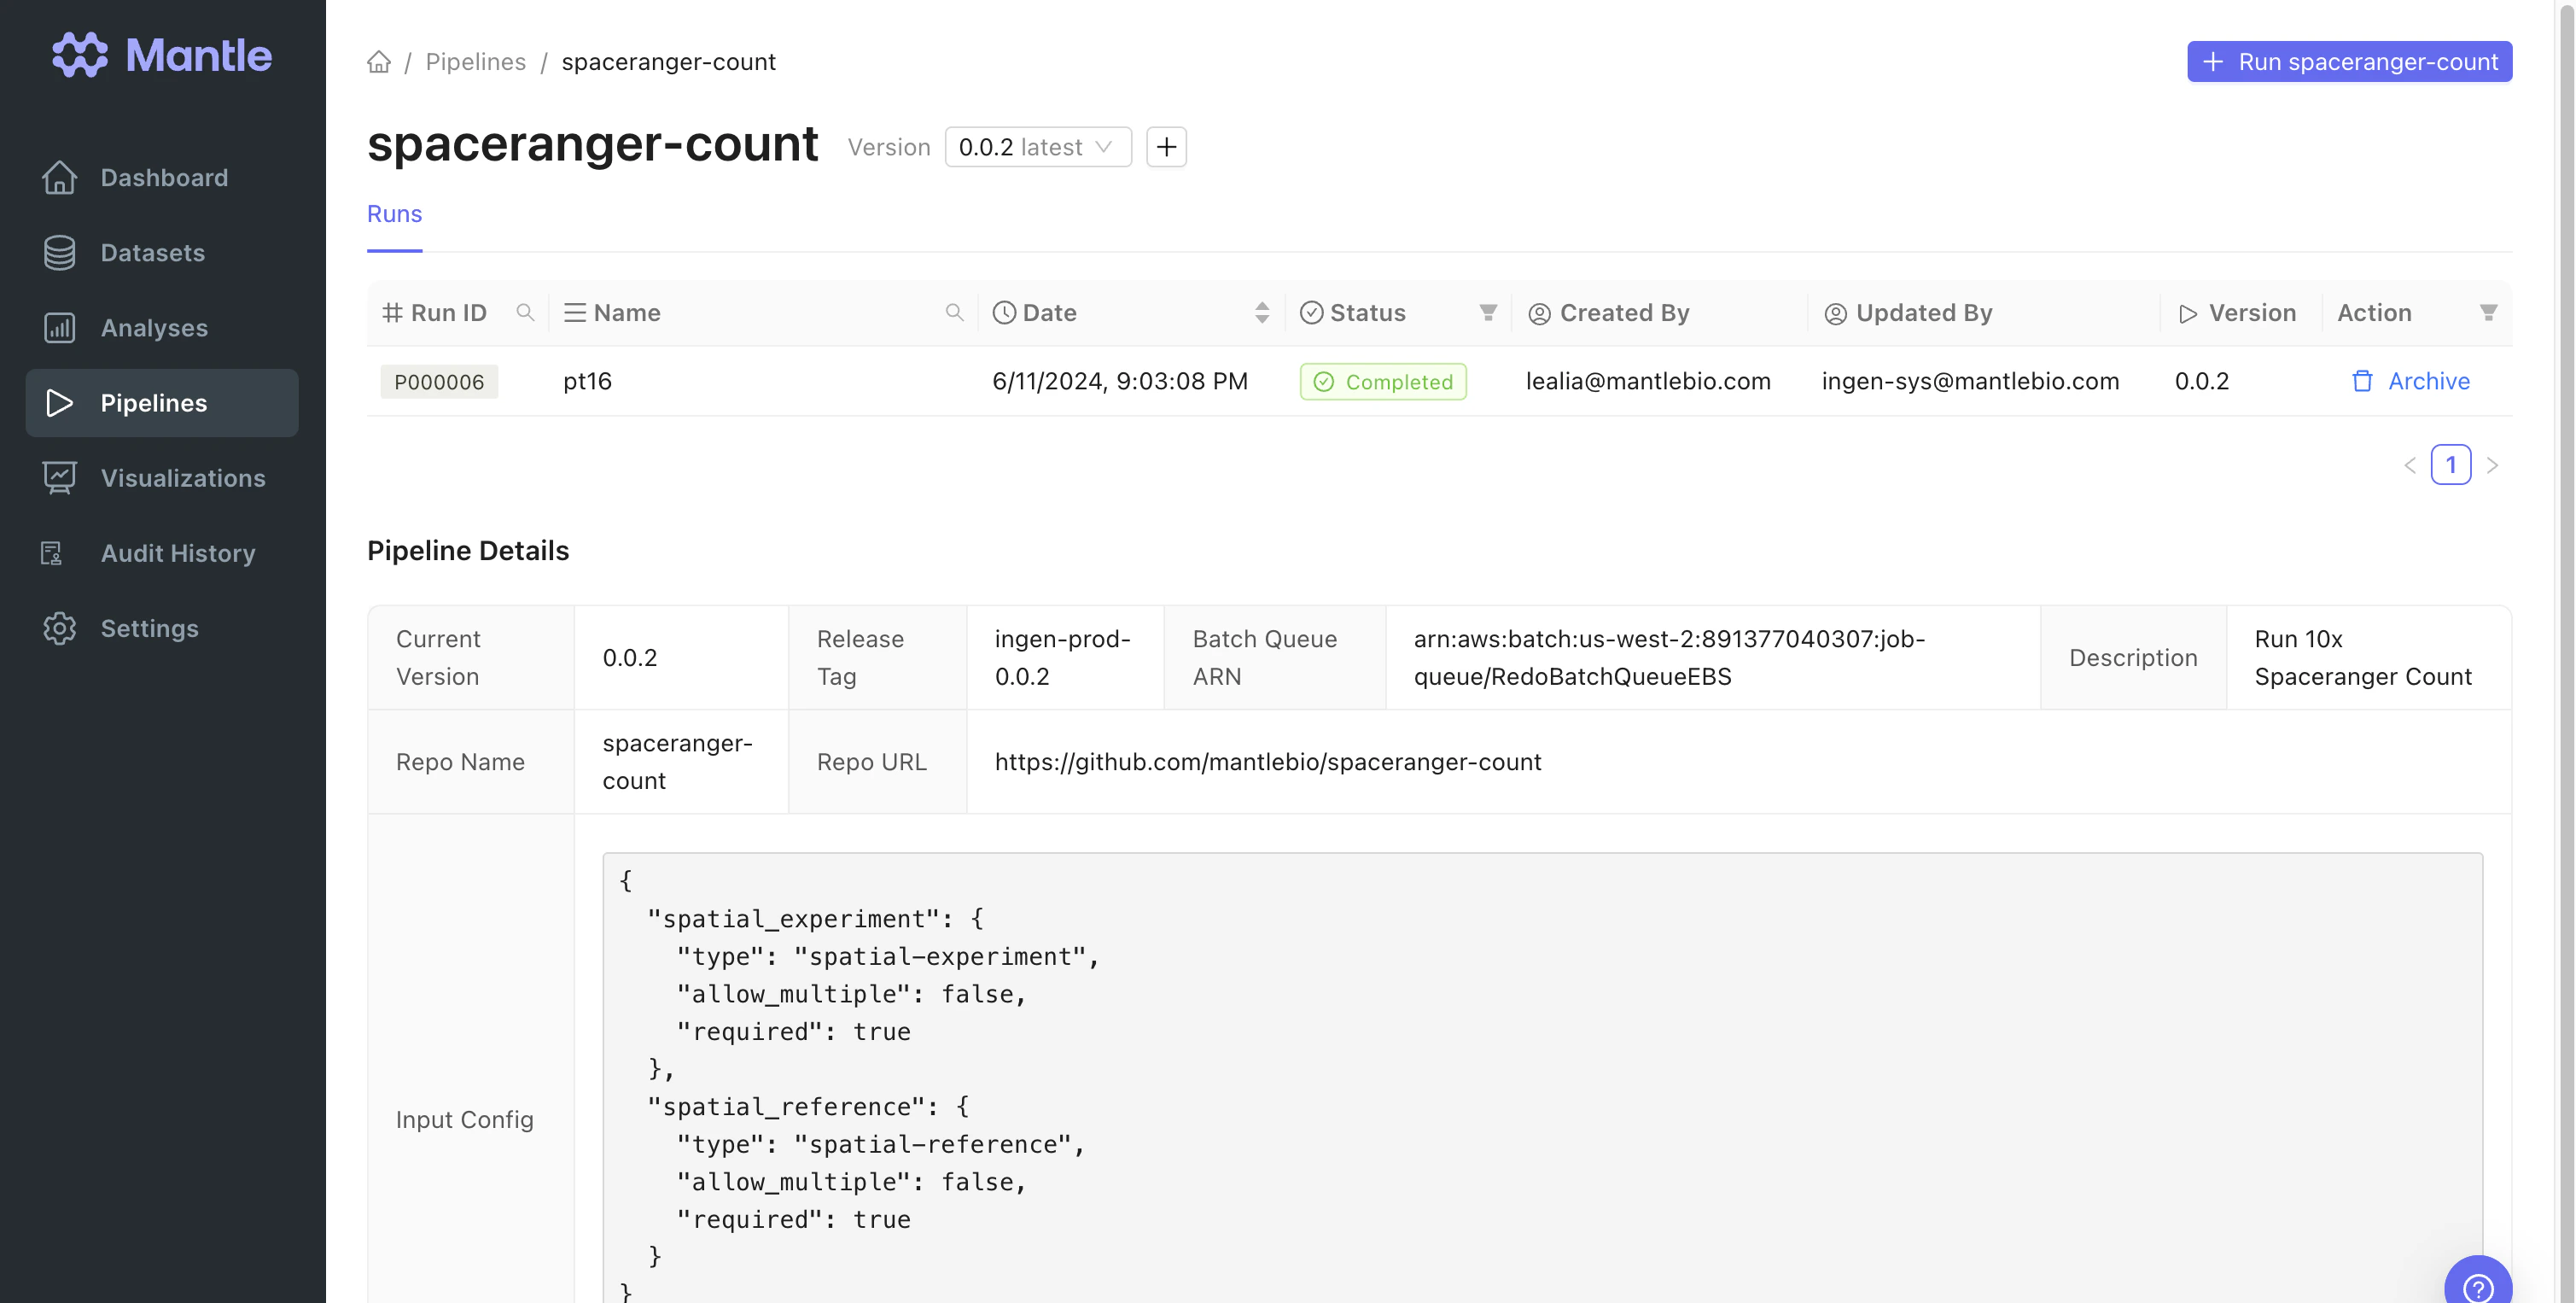 The Mantle `spaceranger-count` pipeline outputs all the files generated by Spaceranger Count, and a `spaceranger-outputs` dataset. The `spaceranger-outputs` data type has
`path_to_output_dir` as a property, which contains the path to the directory containing the Spaceranger Count outputs.
The output dataset is used as an input to a downstream analysis notebook, and serves to link the Spaceranger Count outputs to the input datasets.
The Mantle `spaceranger-count` pipeline outputs all the files generated by Spaceranger Count, and a `spaceranger-outputs` dataset. The `spaceranger-outputs` data type has
`path_to_output_dir` as a property, which contains the path to the directory containing the Spaceranger Count outputs.
The output dataset is used as an input to a downstream analysis notebook, and serves to link the Spaceranger Count outputs to the input datasets.
 ## Analyzing processed data
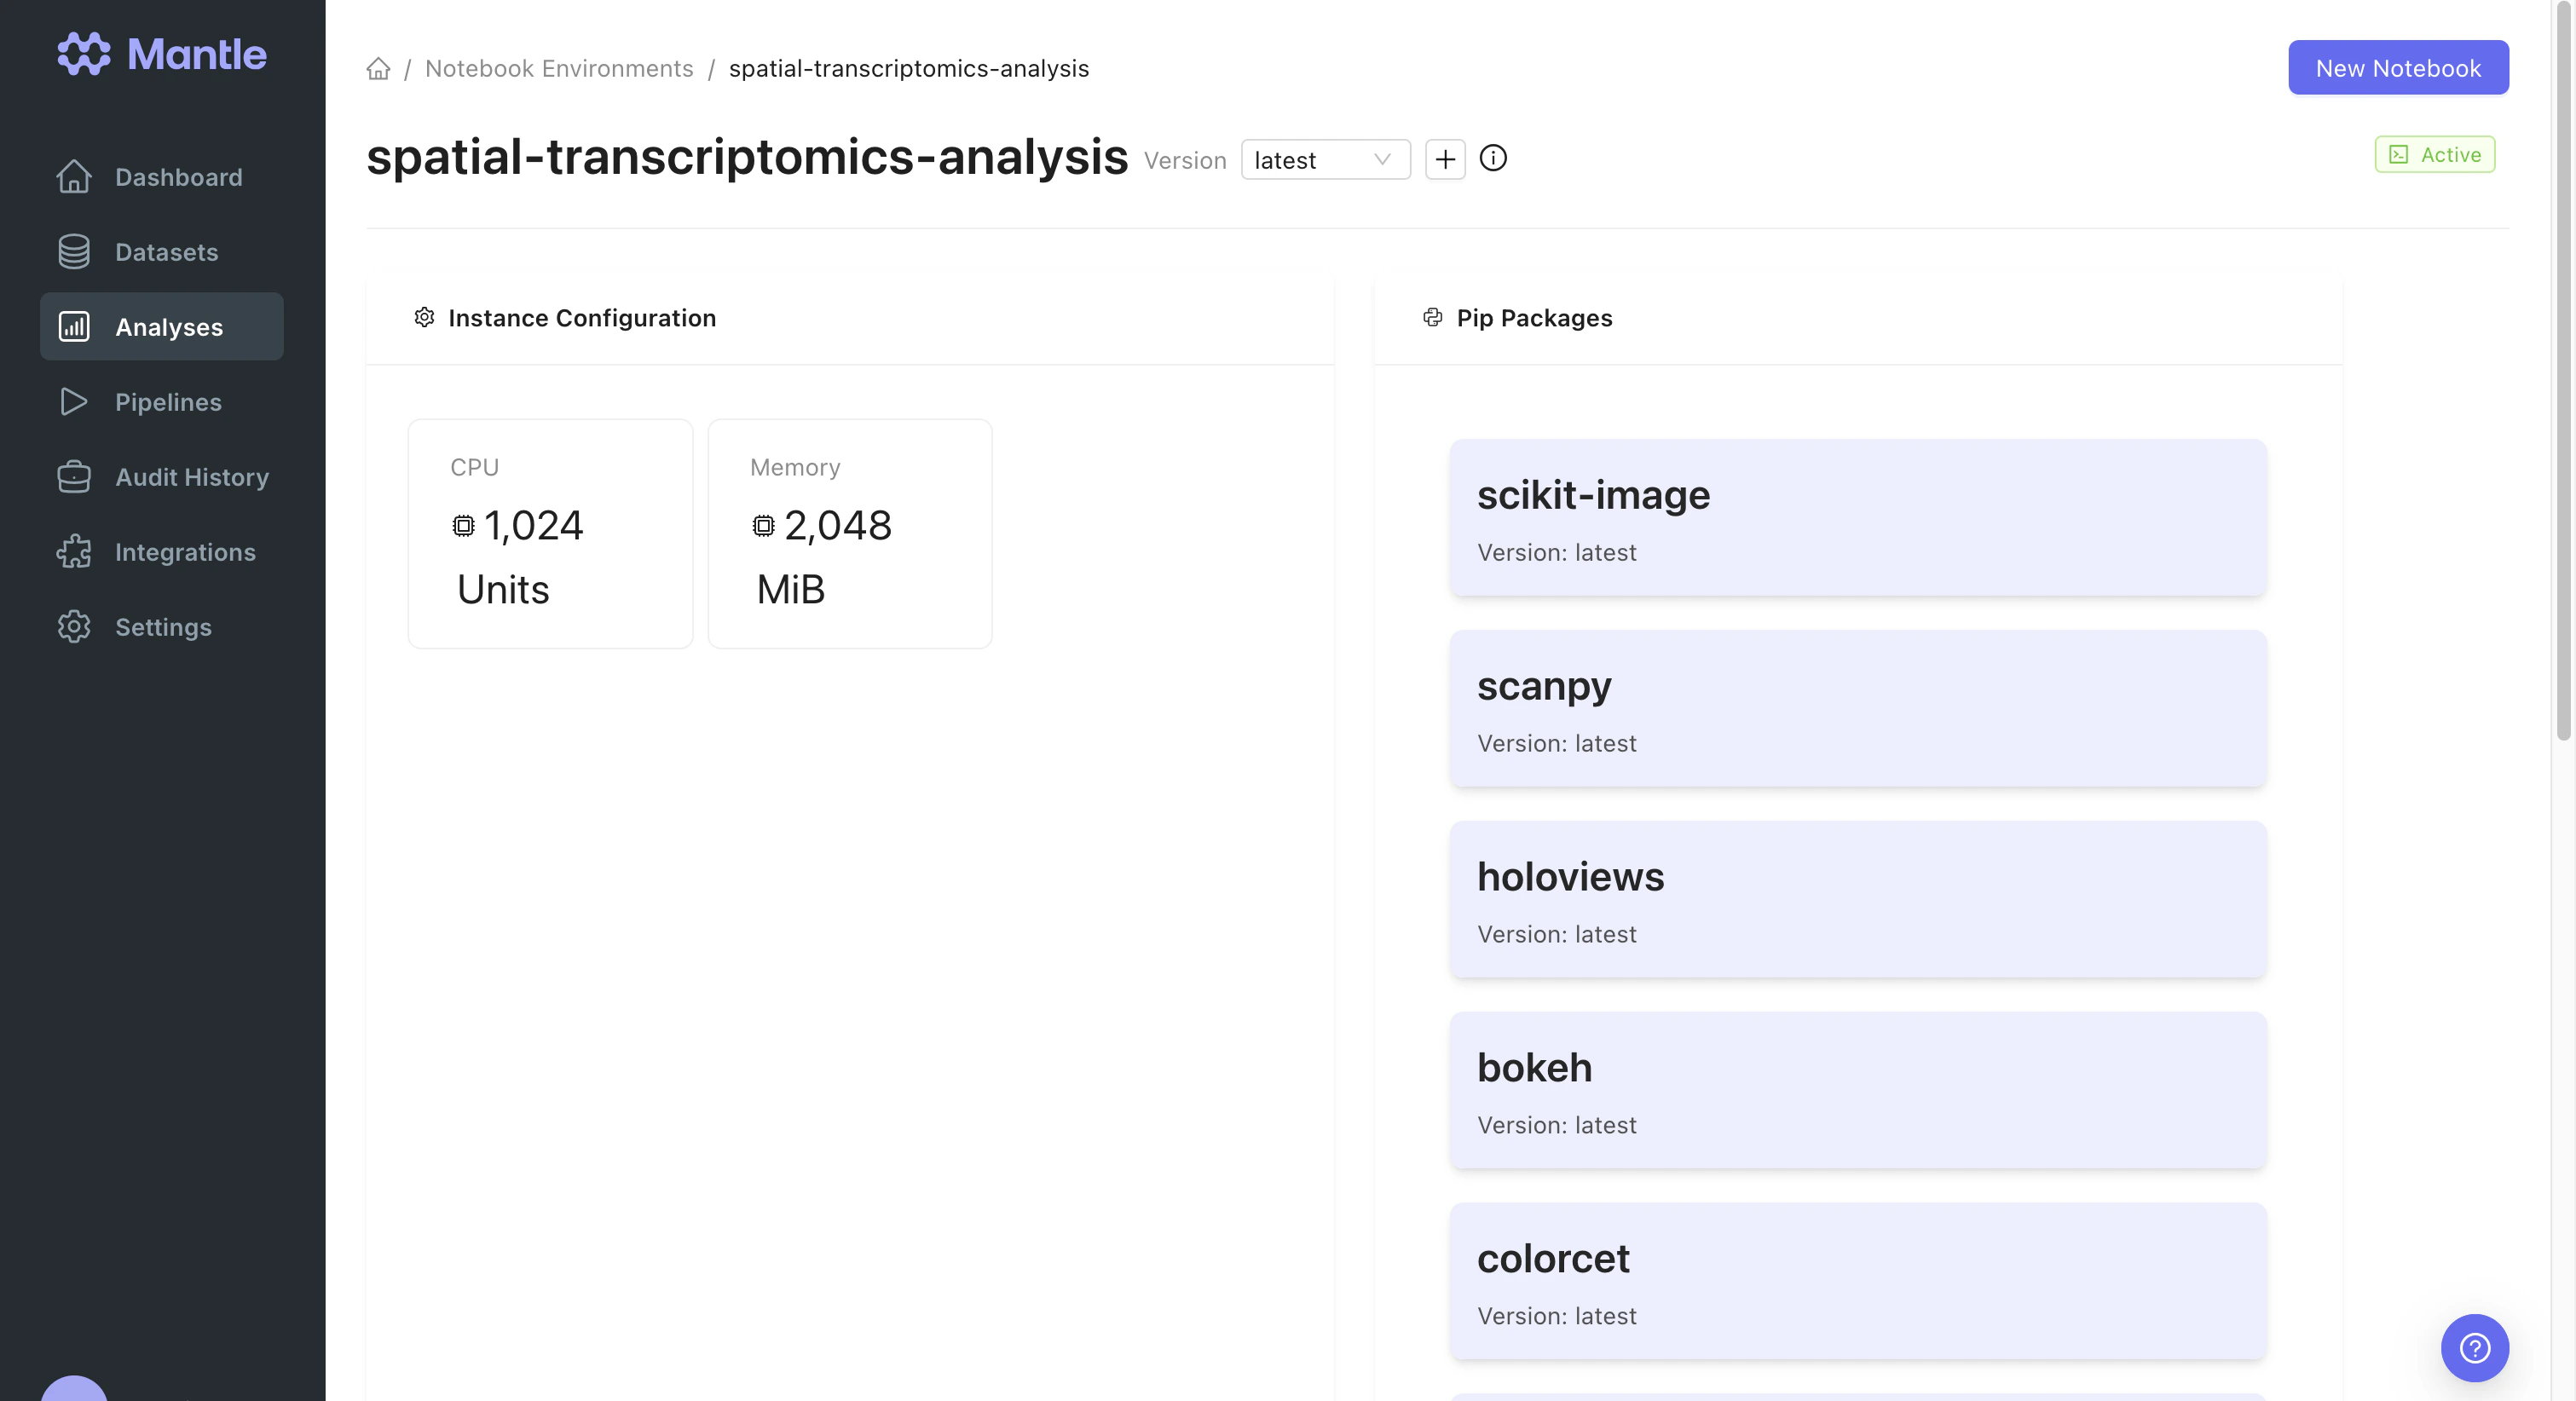
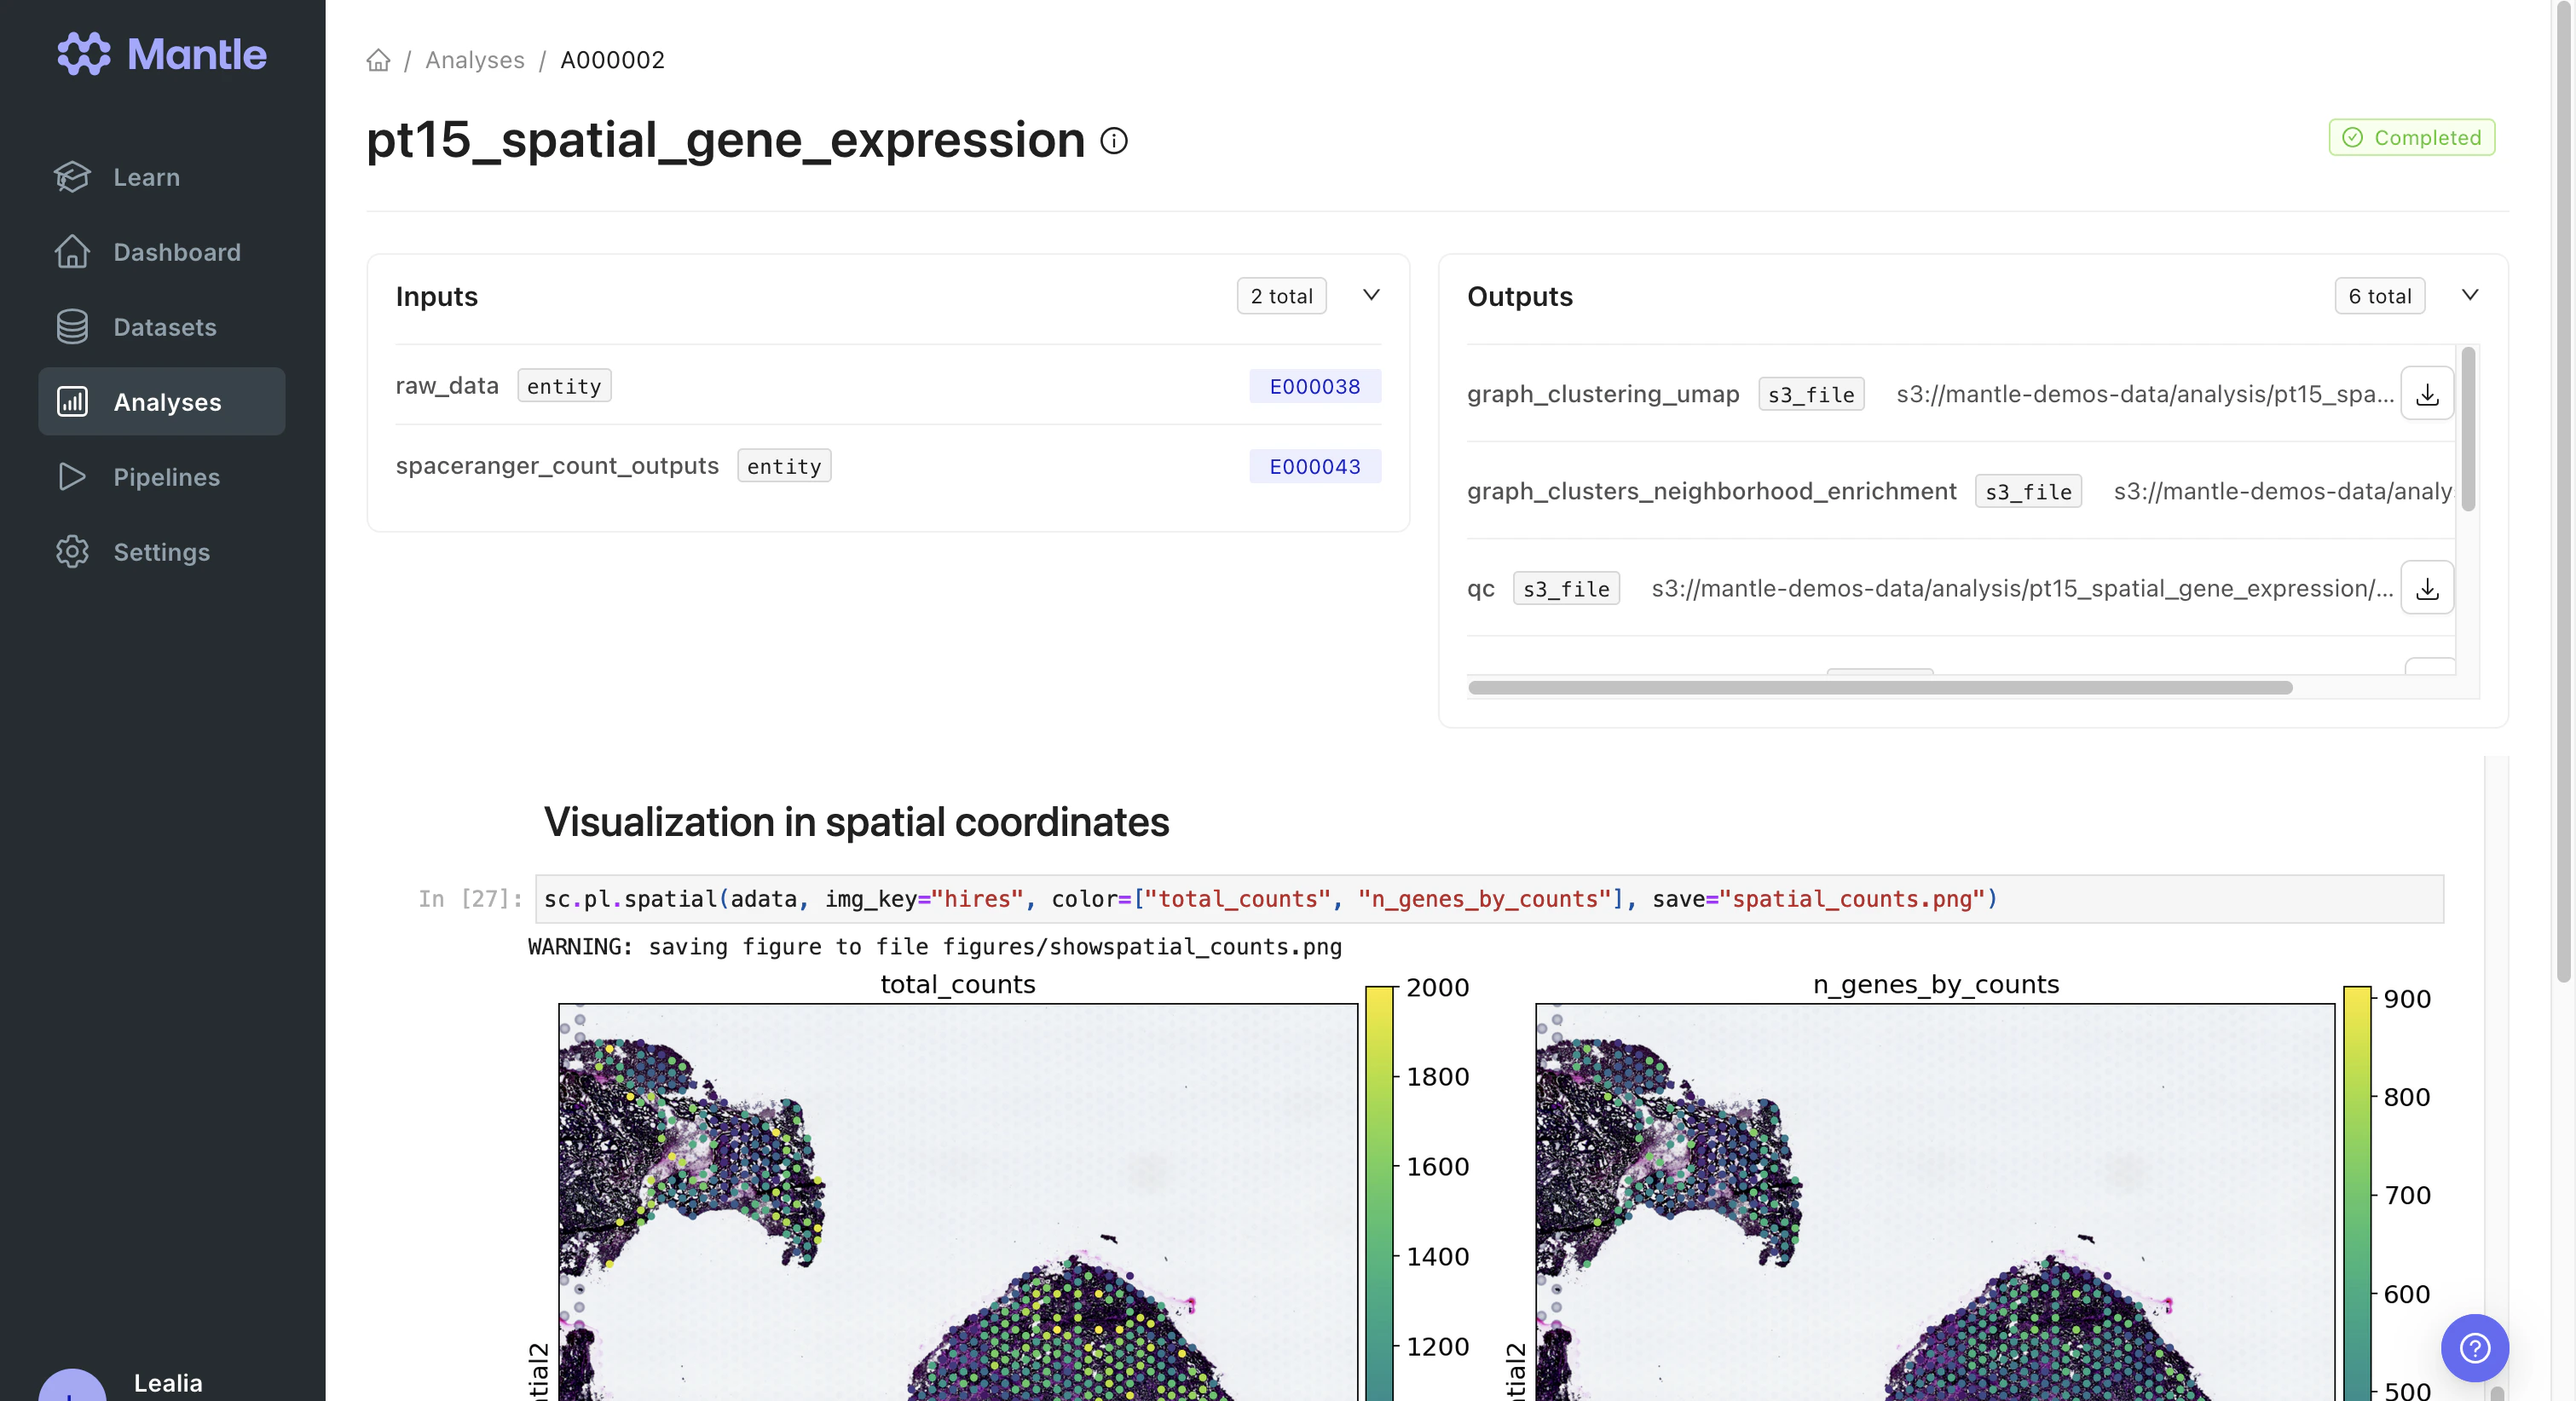
We analyzed the Spaceranger Count outputs in the `pt15_spatial_gene_expression` notebook, which ran in the `spatial-transcriptomics-analysis` analysis environment.
## Analyzing processed data
We analyzed the Spaceranger Count outputs in the `pt15_spatial_gene_expression` notebook, which ran in the `spatial-transcriptomics-analysis` analysis environment.
 Within the notebook, we used the Mantle SDK to stage the Spaceranger Count outputs directory and mark the output dataset from the pipeline as an input to the analysis notebook. We plotted the graph-based clustering calculated by Spaceranger Count. Additionally, we used the Scanpy package to preprocess the transcriptomics data and plot the spatial distribution of several genes of interest.
Finally, we used the Mantle SDK to register the plots as outputs of the notebook.
Within the notebook, we used the Mantle SDK to stage the Spaceranger Count outputs directory and mark the output dataset from the pipeline as an input to the analysis notebook. We plotted the graph-based clustering calculated by Spaceranger Count. Additionally, we used the Scanpy package to preprocess the transcriptomics data and plot the spatial distribution of several genes of interest.
Finally, we used the Mantle SDK to register the plots as outputs of the notebook.
 ## Wrapping up
Spatial transcriptomics data is complex and requires extensive processing and analysis to derive insights from it. Storing image and FASTQ files in a dataset with experimental metadata enables you to keep your data organized. Running Spaceranger Count on Mantle allows you to not worry about provisioning its high computational resource needs or to remember all the command line arguments. Additional analysis, which may change and depends on your experimental goals, can be accomplished in flexible notebooks. Try applying this workflow to your own Visium spatial transcriptomics data!
## Wrapping up
Spatial transcriptomics data is complex and requires extensive processing and analysis to derive insights from it. Storing image and FASTQ files in a dataset with experimental metadata enables you to keep your data organized. Running Spaceranger Count on Mantle allows you to not worry about provisioning its high computational resource needs or to remember all the command line arguments. Additional analysis, which may change and depends on your experimental goals, can be accomplished in flexible notebooks. Try applying this workflow to your own Visium spatial transcriptomics data!