> ## Documentation Index
> Fetch the complete documentation index at: https://docs.mantlebio.com/llms.txt
> Use this file to discover all available pages before exploring further.
# Differential gene expression from bulk RNAseq using Scanpy on Mantle
A bulk RNAseq gene expression matrix is a gene by sample matrix containing the raw or normalized counts of reads that were aligned to each gene in each sample. Once you have obtained a gene expression matrix (e.g. by processing a set of FASTQ files from different samples through the [Mantle `bulk-rnaseq` pipeline](/workflows/bulk_rnaseq_processing)), there a variety of tools that can be used to perform differential gene expression analysis, including the [Scanpy](https://scanpy.readthedocs.io/en/stable/) package in Python.
Gene expression matrices, also known as count matrices, can be stored in your Mantle Database using the `count_matrix` data type.
In this notebook, we analyze the gene level raw counts matrix obtained using STAR and Salmon through the `bulk-rnaseq` pipeline. The FASTQ data were originally from:
> Wu, A. C. K., Patel, H., Chia, M., Moretto, F., Frith, D., Snijders, A.
> P., & van Werven, F. J. (2018). Repression of divergent noncoding
> transcription by a sequence-specific transcription factor. Molecular
> Cell, 72(6), 942-954.e7. [https://doi.org/10.1016/j.molcel.2018.10.018](https://doi.org/10.1016/j.molcel.2018.10.018)
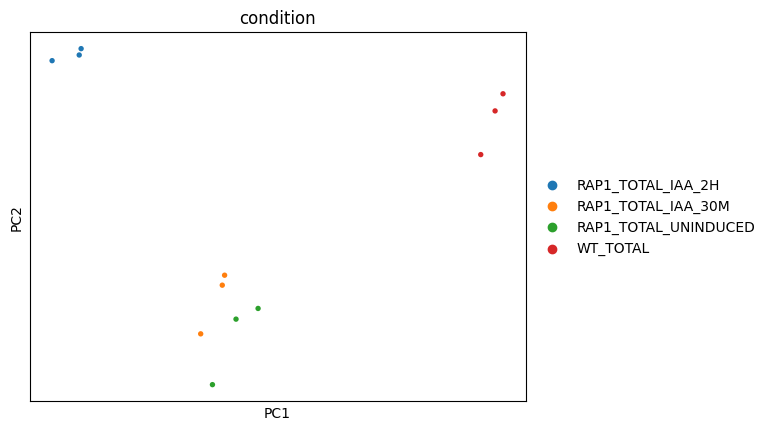
Using Scanpy, we load the count matrix into AnnData format, then normalize and transform the count matrix and perform principal component analysis.
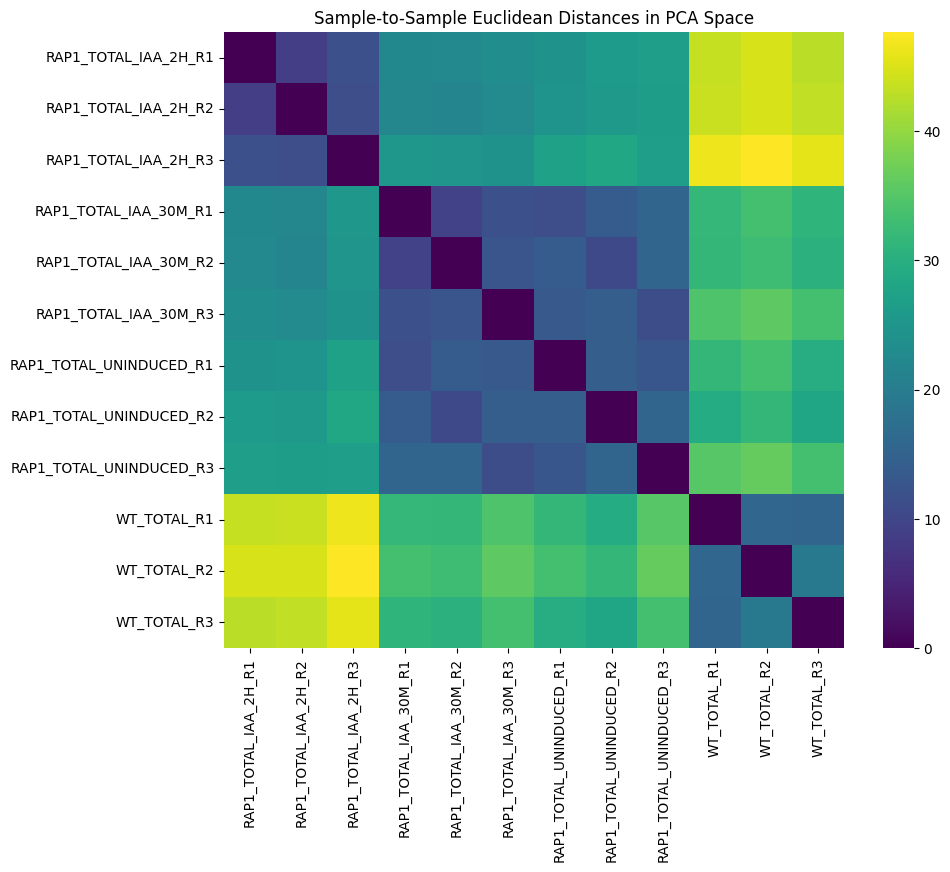
 We use the PCA embedding to calculate sample-to-sample Euclidean distances.
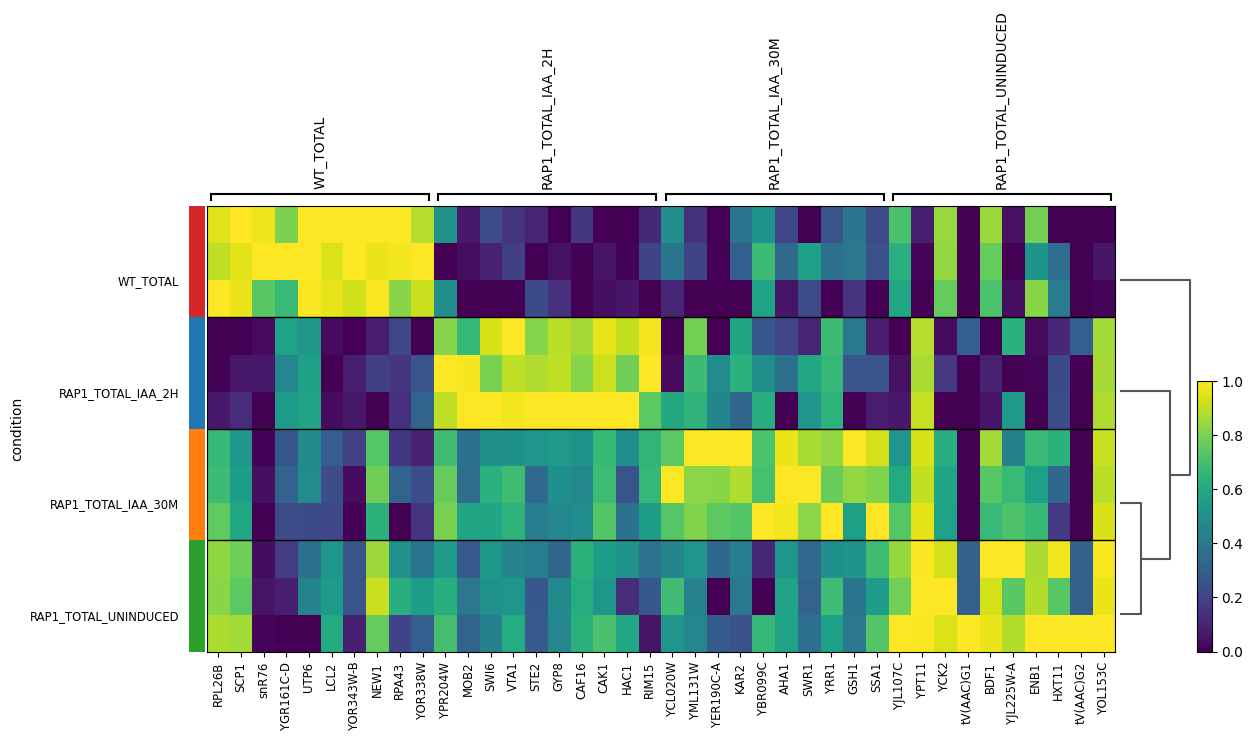
 We then use Scanpy to look at the top genes by mean expression for each condition.
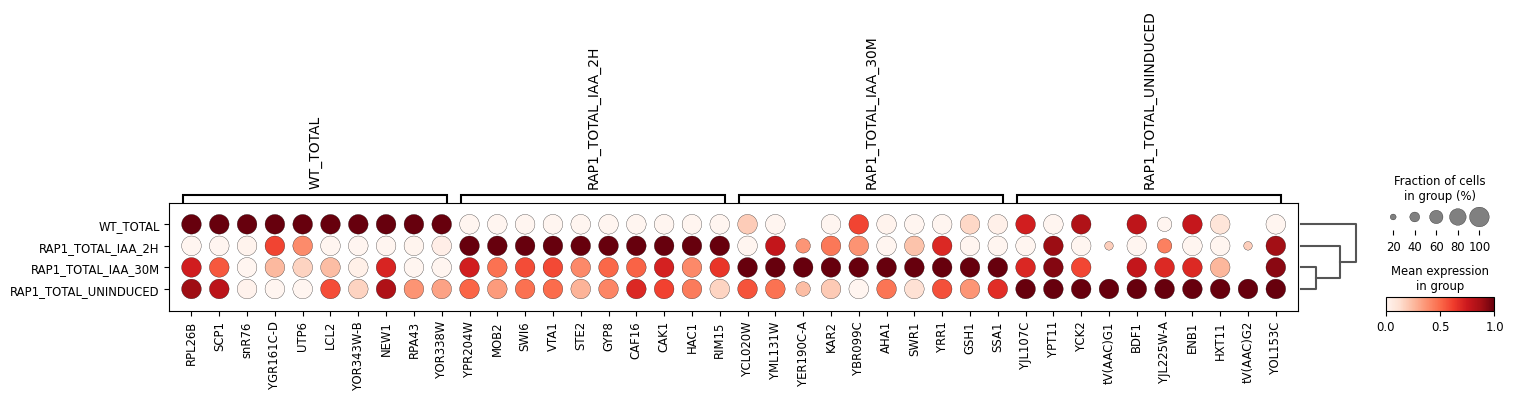
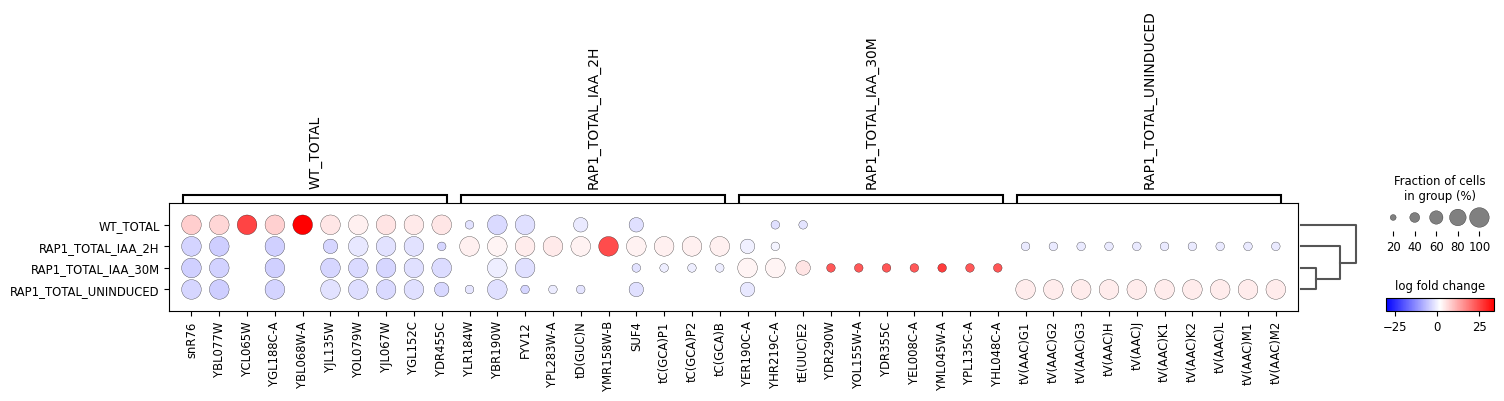
 Additionally, we use Scanpy to look at the top genes by log fold-change for each condition.
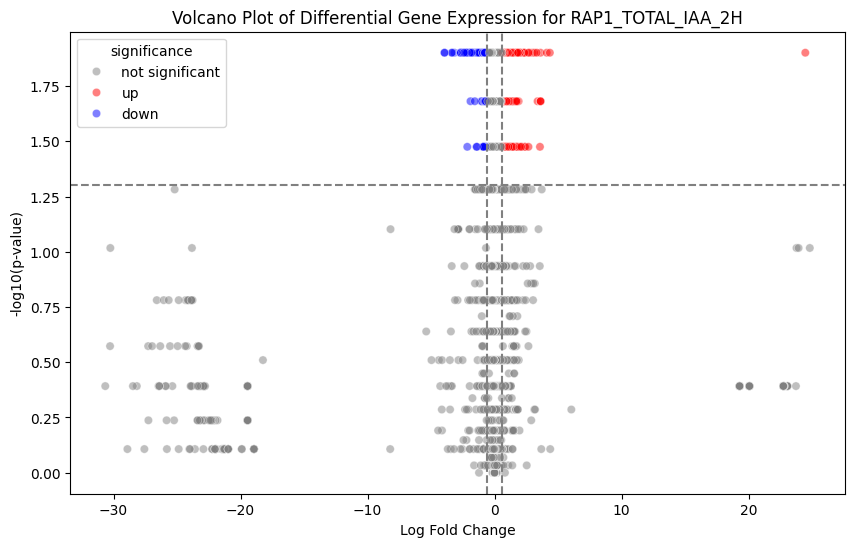
 Finally, we use the log fold-change to make volcano plots of differential gene expression for different conditions.