> ## Documentation Index
> Fetch the complete documentation index at: https://docs.mantlebio.com/llms.txt
> Use this file to discover all available pages before exploring further.
# Fluorescence quantification after image segmentation using Cellpose
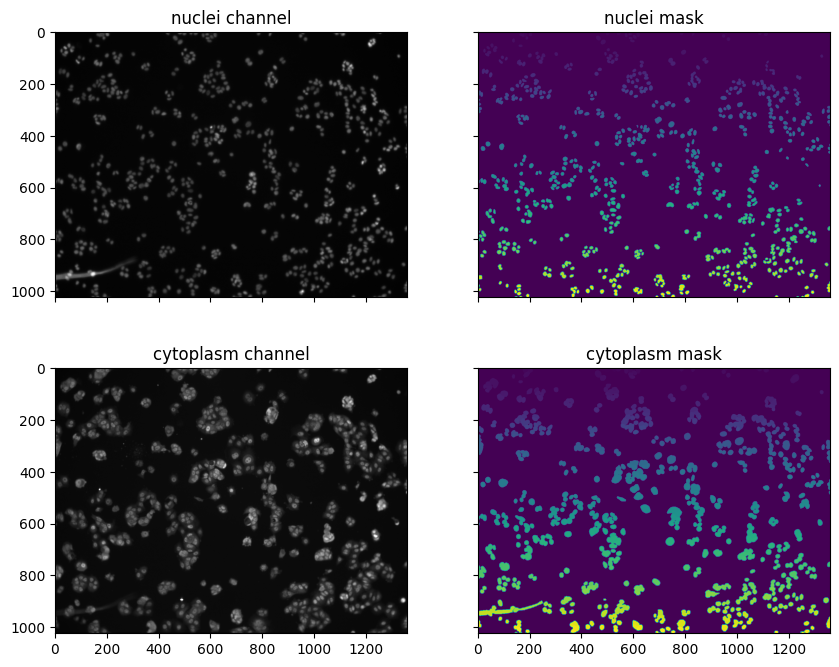
Cellular segmentation (e.g. using the [Mantle `cellpose-segmentation` pipeline](/workflows/cellpose_segmentation_processing)) results in masks that identify where cell bodies and/or nuclei are located in an image. Once you have obtained masks, you can use them to quantify the concentration of the labeled molecules within the segmented regions using tools such as the [scikit-image](https://scikit-image.org/) package in Python.
In this notebook, we compare the quantity of a protein of interest (transcription factor NFκB) in the cytoplasm versus the nucleus of cell in response to varying doses of TNF-α. The microscopy data were originally from the BBBC014v1 dataset, available from the Broad Bioimage Benchmark Collection.
> Ljosa, V., Sokolnicki, K. L., & Carpenter, A. E. (2012). Annotated high-throughput microscopy image sets for validation. Nature Methods, 9(7), 637-637.
Using scikit-image, we read in the images and masks and extract the mean intensity of each labeled region. Using Pandas, we filter for segmented cells that contain exactly one segmented nucleus.
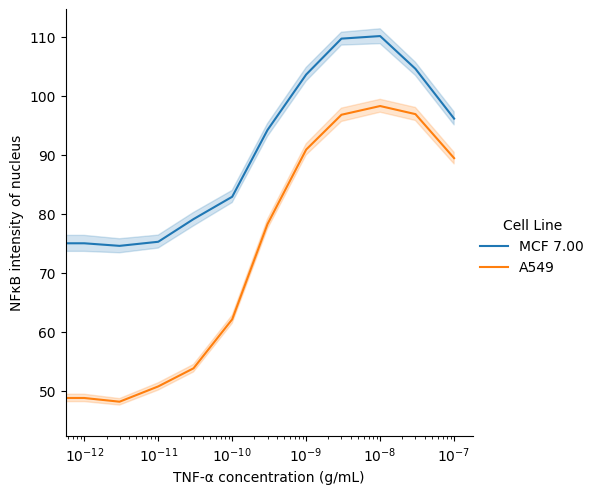
 Then, we can plot the mean intensity of the nucleus against concentration of TNF-α:
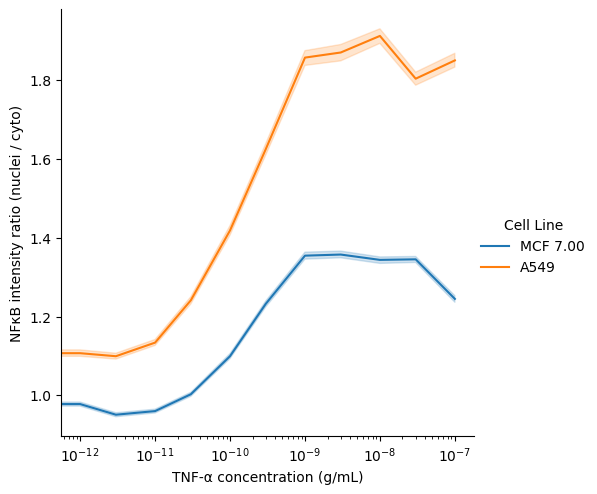
 as well as the ratio of mean intensity of the nucleus to mean intensity in the cytoplasm against concentration of TNF-α: