> ## Documentation Index
> Fetch the complete documentation index at: https://docs.mantlebio.com/llms.txt
> Use this file to discover all available pages before exploring further.
# Visualizing results from Visium spatial transcriptomics with Scanpy on Mantle
The [10x `spaceranger count` pipeline](/workflows/visium_spatial_transcriptomics_processing) produces feature-barcode matrices as well as performing dimensionality reduction, clustering, and differential gene expression analysis. The results directory of the pipeline can be stored in your Mantle Database using the `spaceranger-count-outputs` data type.
In this notebook, we use Scanpy to take a closer look at some of the results. The Visium data were originally from:
* Sudmeier, et al. (2022) “Distinct phenotypic states and spatial distribution of CD8+ T cell clonotypes in human brain metastases.” Cell Reports Medicine, 3(5), 100620
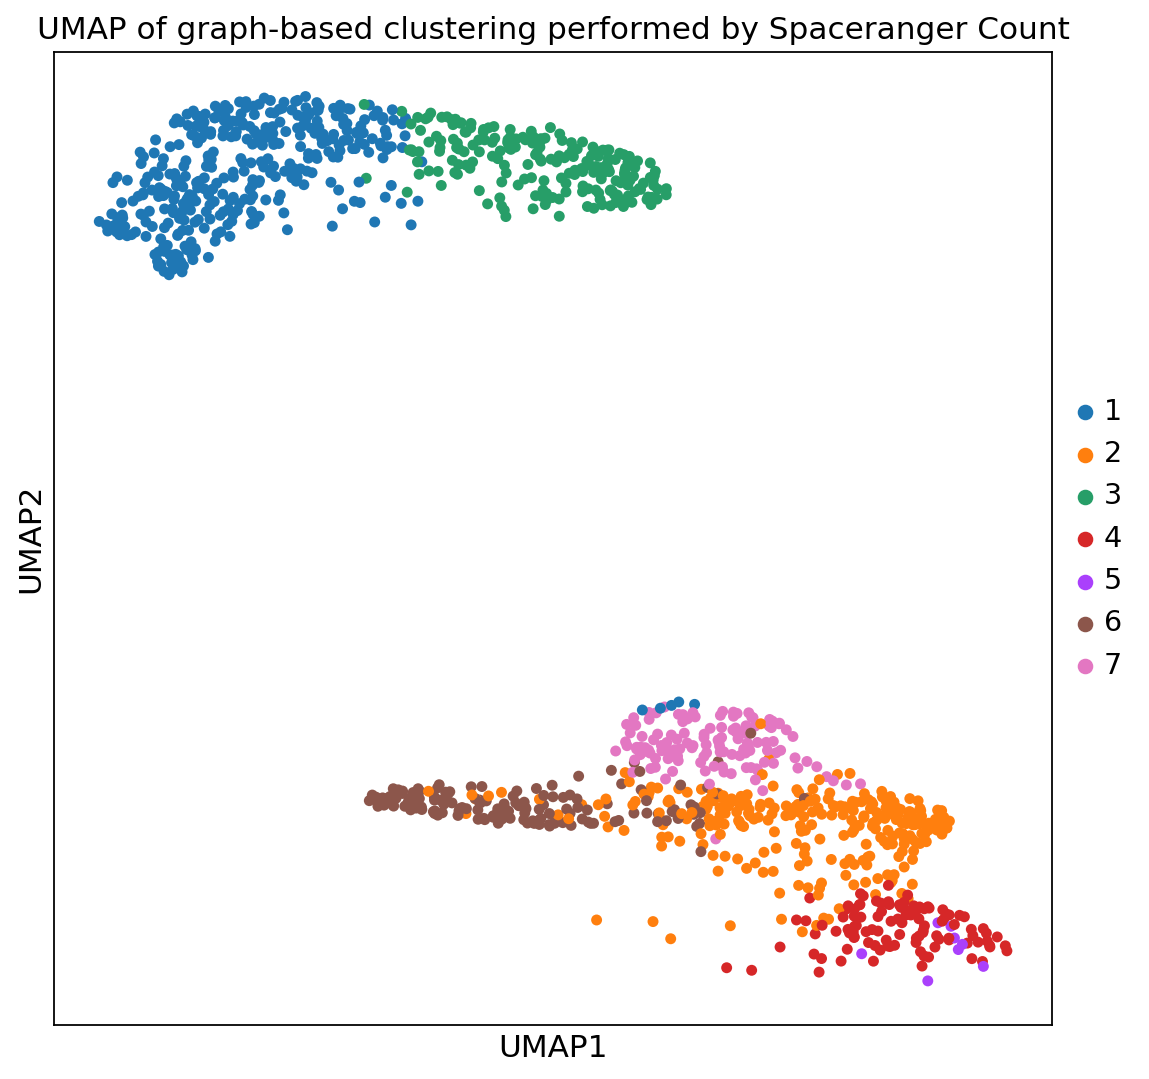
Using Scanpy, we read the Visium data into AnnData format and annotate it with the UMAP and graph-based clustering results. Then, we filter and normalize.
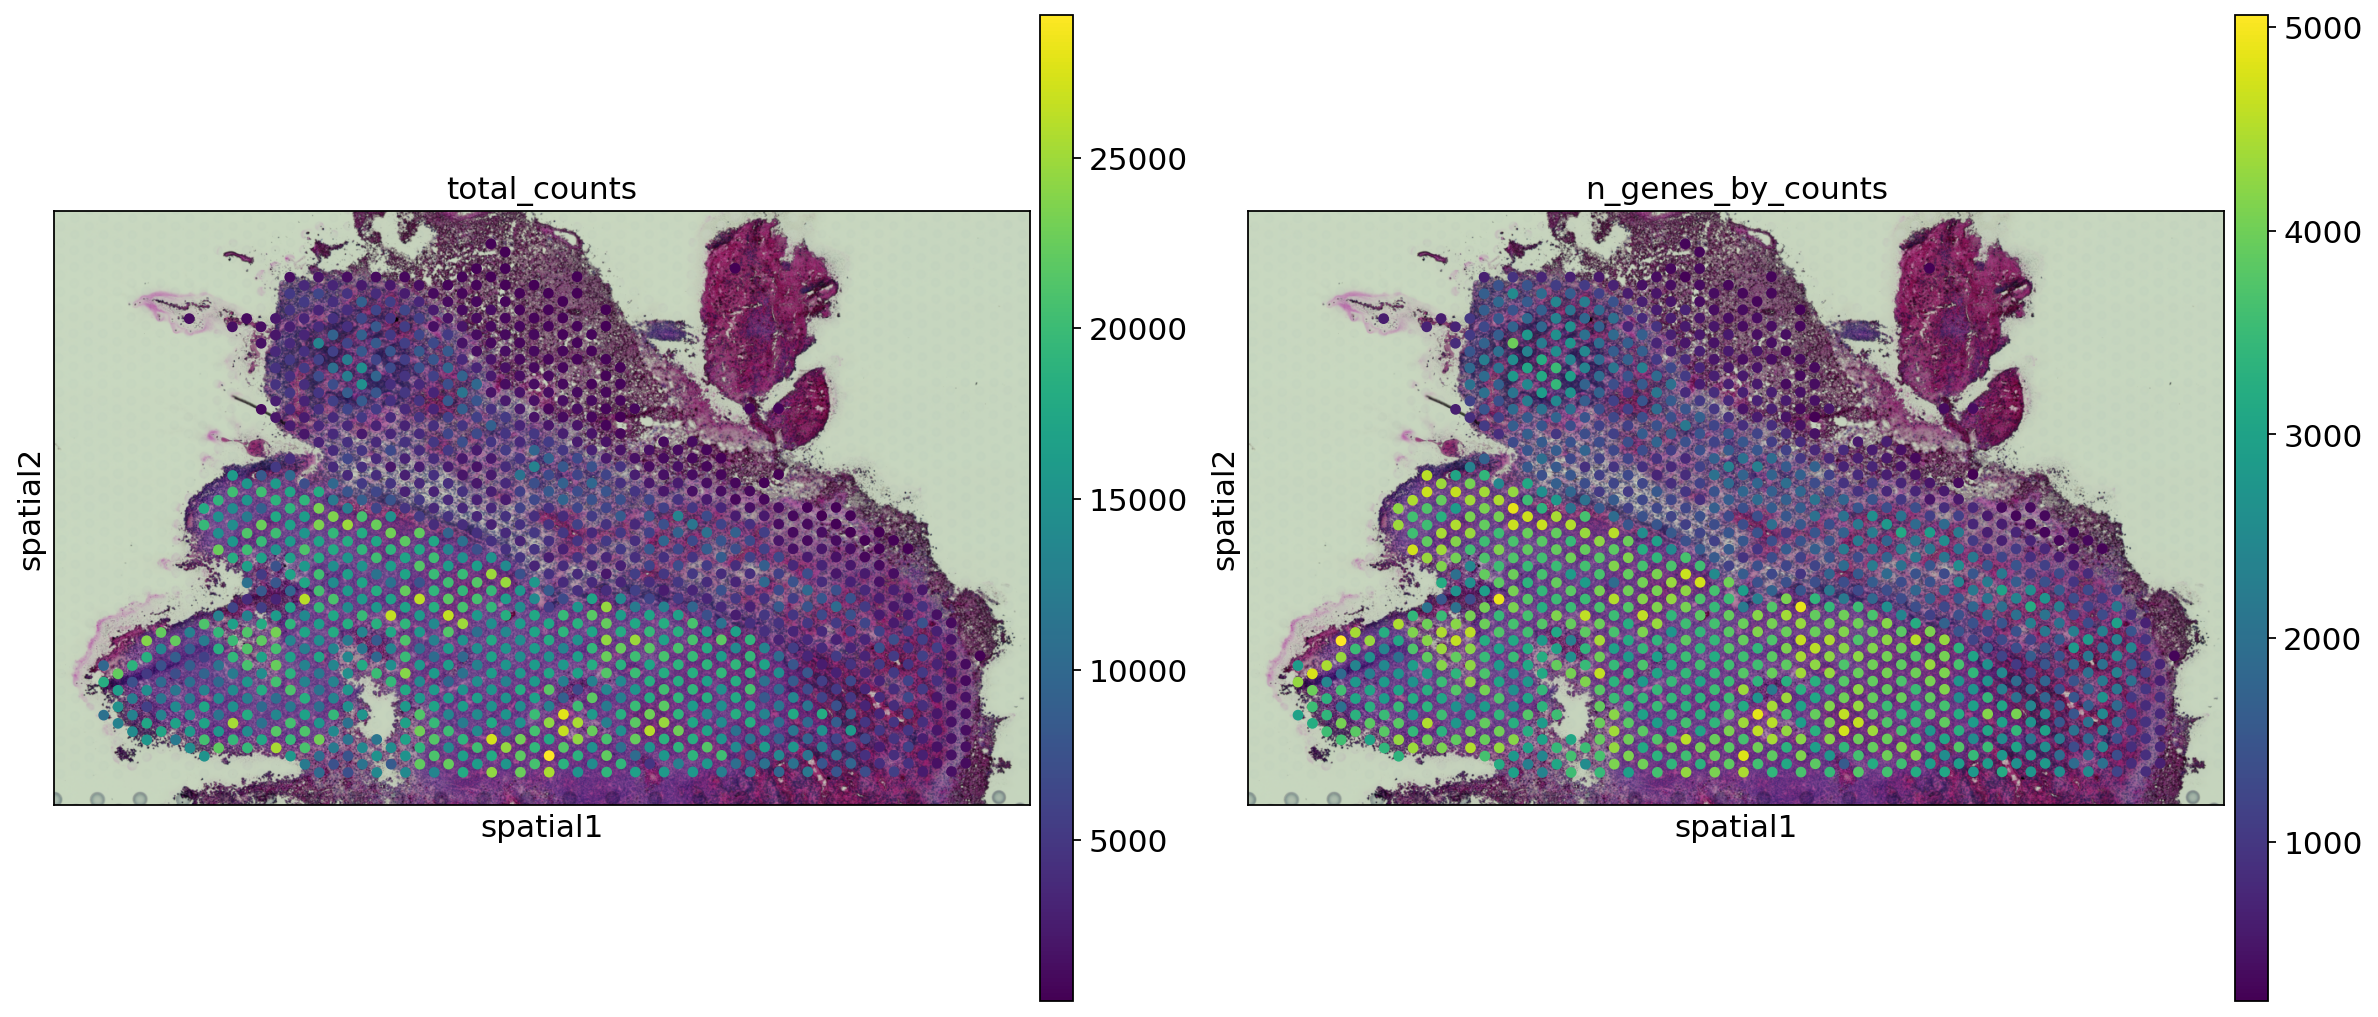
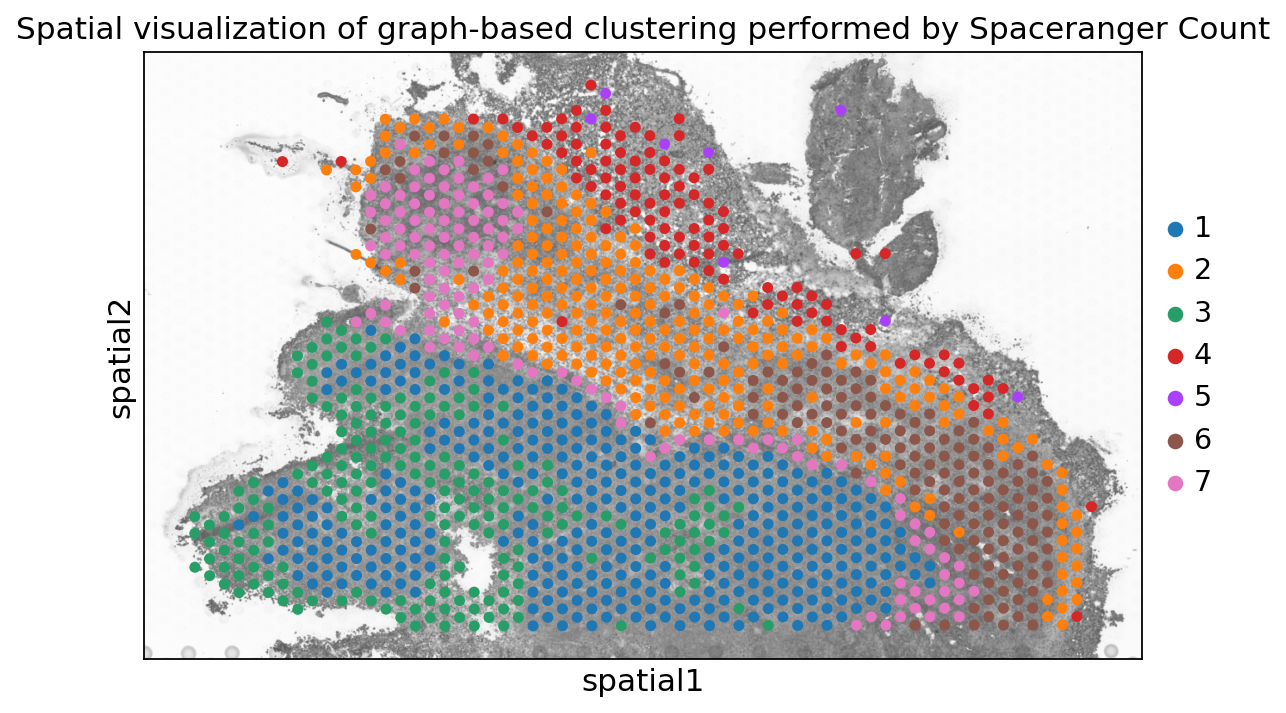
We then use Scanpy to visualize gene counts in spatial coordinates and visualize clustering in UMAP and spatial coordianates.
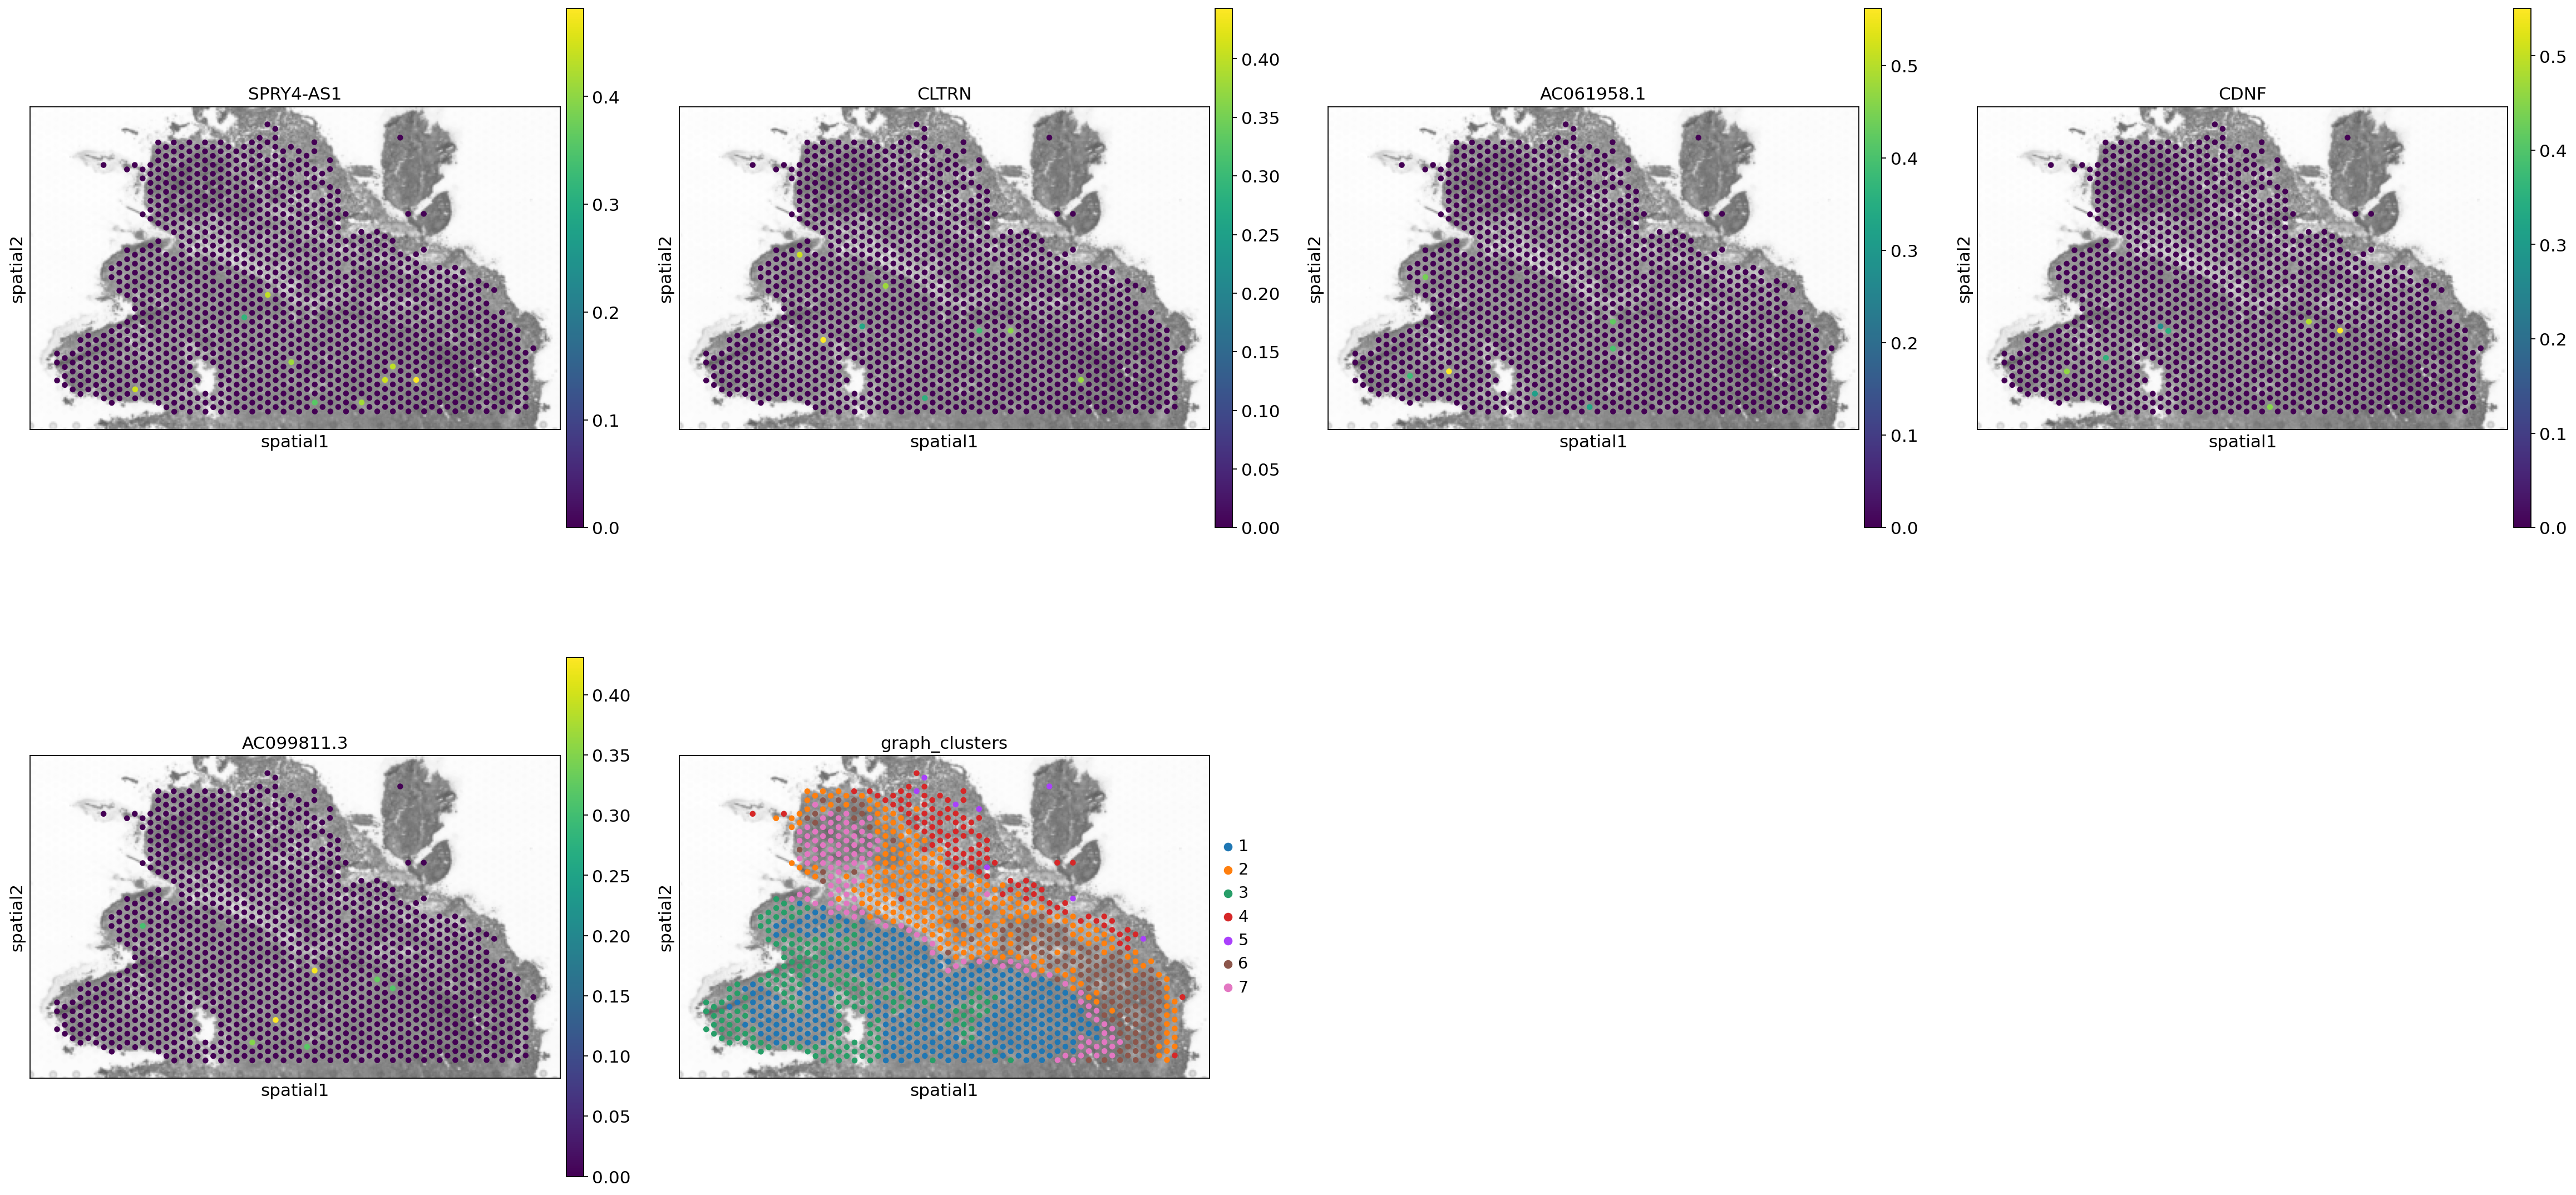
 Spaceranger Count also performs gene expression. We annotate our Visium results with the top genes and then use Scanpy to plot the spatial distribution of top genes for one of the clusters.
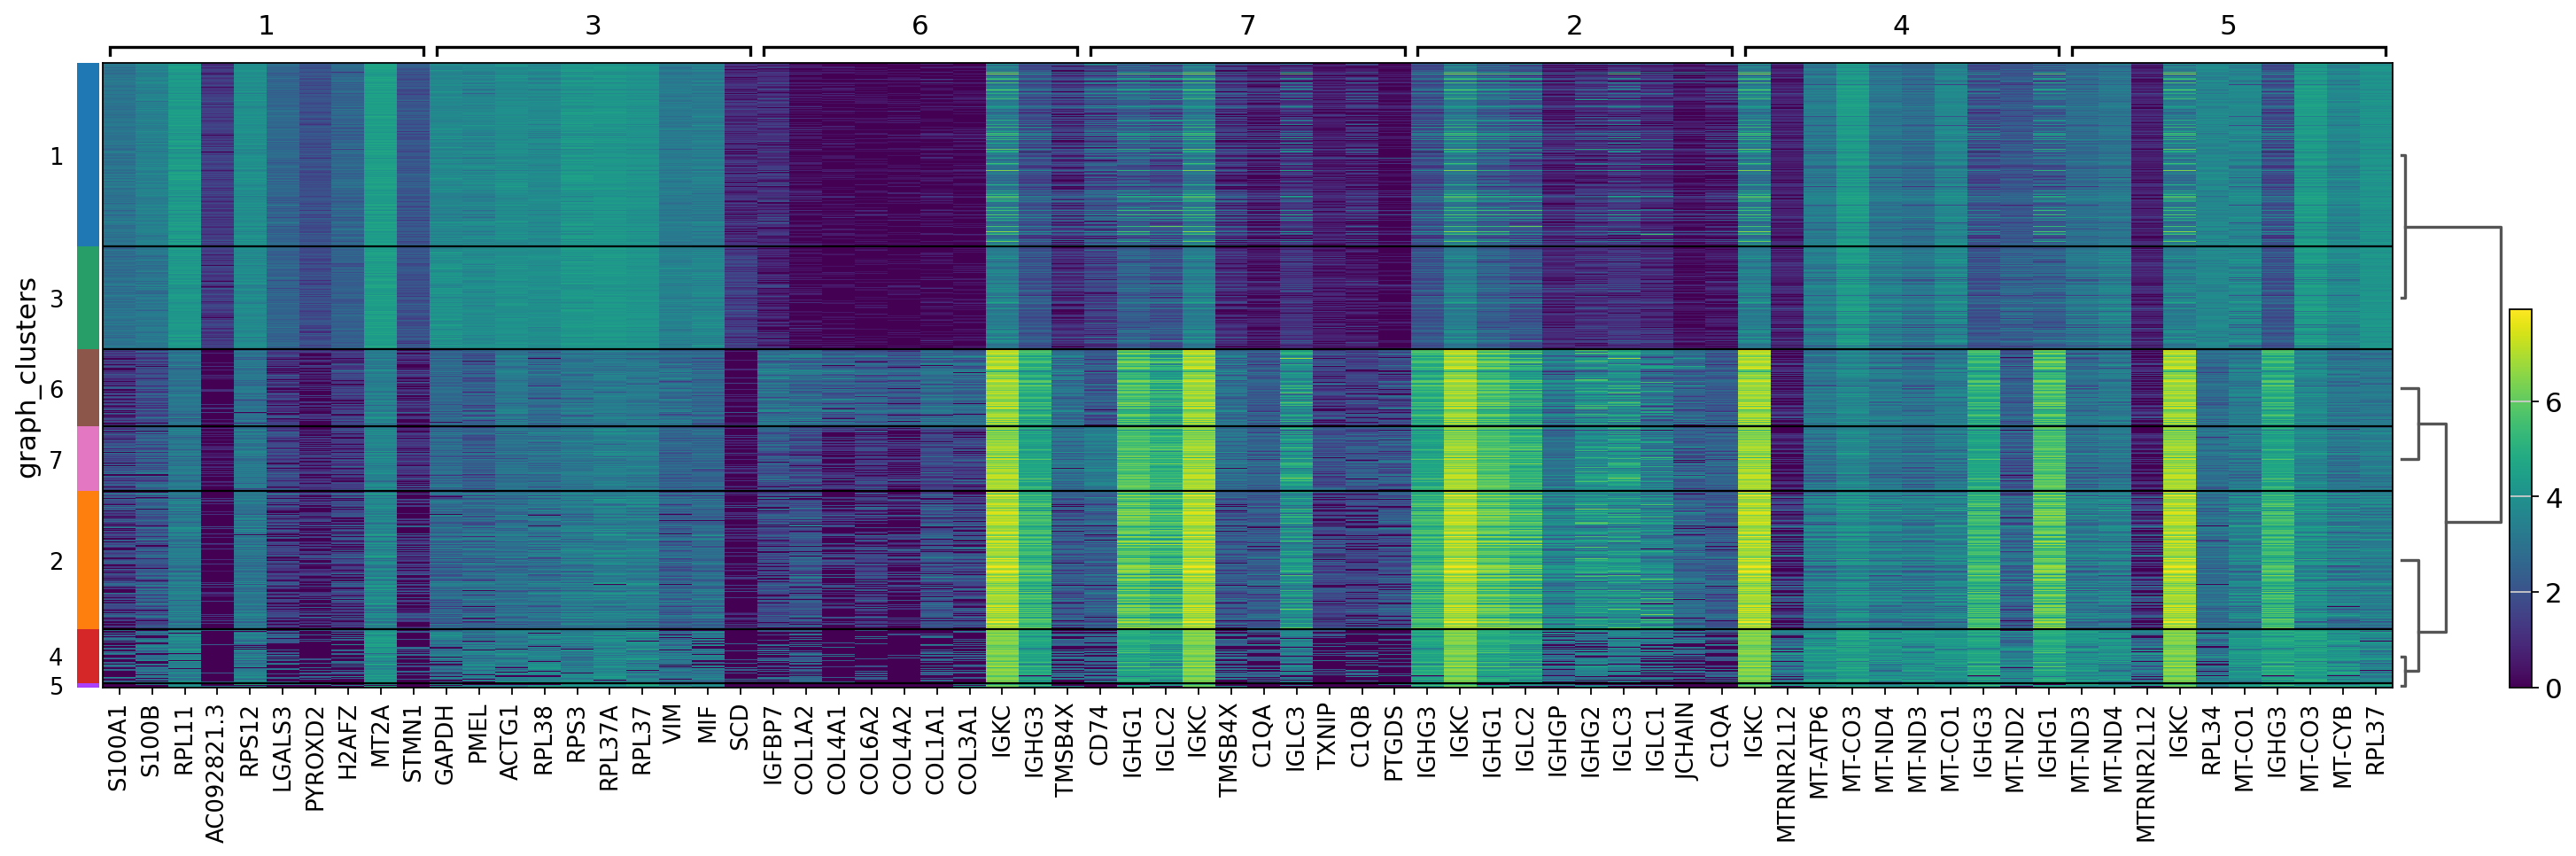
 Additionally, we use Scanpy to rank the genes for each cluster and plot a heatmap.
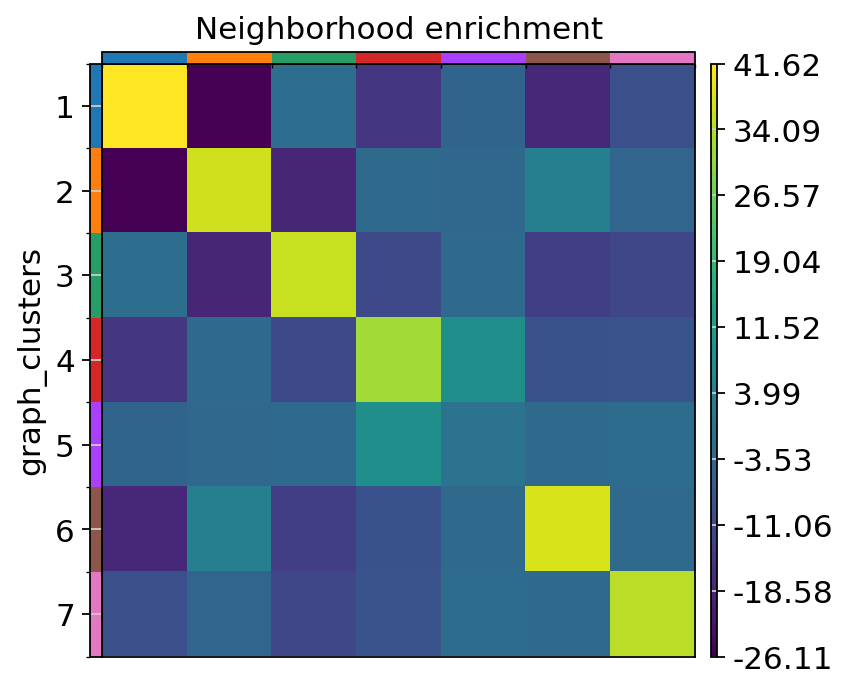
 Finally, we also use Squidpy to perform spatial statistics.